How can geospatial information systems strengthen the blue economy?
Fisheries can use geospatial information systems to analyze ocean data, optimize resources and improve decision-making amid climate change
Global warming, pollution and overfishing are making it increasingly important that the fisheries sector adapts to a changing marine environment. One way in which it can do this is by leveraging the power of geospatial information systems (GIS) to make key decisions based on the spatial context of a situation.
By connecting data to a map and integrating location data with descriptive information, GIS provides a foundation for mapping and analysis that is used in science and industry. It also helps users understand geographic contexts or patterns, improving communication, efficiency, management and decision-making.
In the United States, the National Oceanic and Atmospheric Administration (NOAA) and local intelligence firm Esri are tapping into the potential of GIS by creating an open data platform to make ocean-related data more accessible and actionable through location analytics, digital maps, dashboards, web portals and more. By bringing together layers of authoritative data including physical attributes about the ocean – temperature, depth or seafloor composition – the new platform will combine data resources to prioritize emerging plans and aid decisions. It will leverage NOAA’s data with Esri’s geospatial technical innovations and capabilities to help fisheries address critical issues using information that is tailored to their needs.
“The ocean is a rapidly changing environment and fisheries are highly susceptible to this,” Dan Pisut, senior principal engineer at Esri, told the Advocate. “There are also many demands on the ocean aside from fisheries, and a lot of spatial conflict, while more initiatives and business ventures, such as offshore wind farms, rely increasingly on the marine environment. How can we optimize where these sectors are now, and where they will be in future? How do we optimize our use of resources in the ocean, and what are the demands for protecting species, habitats, or coastal development? We are pulling information together and using spatial analysis and maps to determine areas of potential success or conflict.”

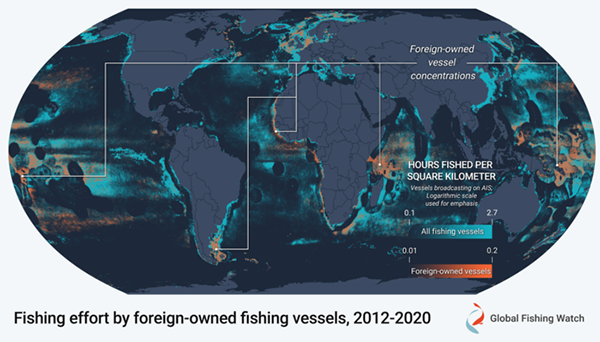
The platform is still under development, and will include data from different sources, including NOAA data and Esri partners. One such partner is Global Fishing Watch, which is providing data on the destination of fishing fleets, seasonal patterns of fishing and shipping activity such as passenger vessels, cruise ships, or oil tankers that might be in conflict with fisheries.
The platform will also identify vessels entering protected areas or no-take zones and measure parameters such as water temperature, pH levels and how these change over time. Other information in the platform includes data on critical habitats that require protection, to better understand their conditions and how they may look like in future. The platform will showcase how large volumes of data can be distilled into localized, relevant information and leverage web services that allow stakeholders to filter data based on their areas or topics of interest, or turn big data into something smaller and more usable.
“It’s about providing applications and templates by which stakeholders can integrate the data with their own information and customize that to be more insightful for their area,” said Pisut. “They will be able to regionalize and contextualize an area of interest, and bring in any data that they might be collecting from their own organization. Our goal is to build an open system that makes all of this possible.”
The platform will be freely available for purposes such as monitoring species habitats, identifying regulated fishing areas or tracking fishing fleets. Pisut adds that there are some challenges, such as keeping up with constant, rapid environmental change and adapting databases and GIS at the necessary rate to achieve genuine progress. For now, however, the team want to support the growing blue economy by giving sectors like fisheries some geographic context, providing real-time data and building a system that summarizes different points that can be put toward effective long-term planning.
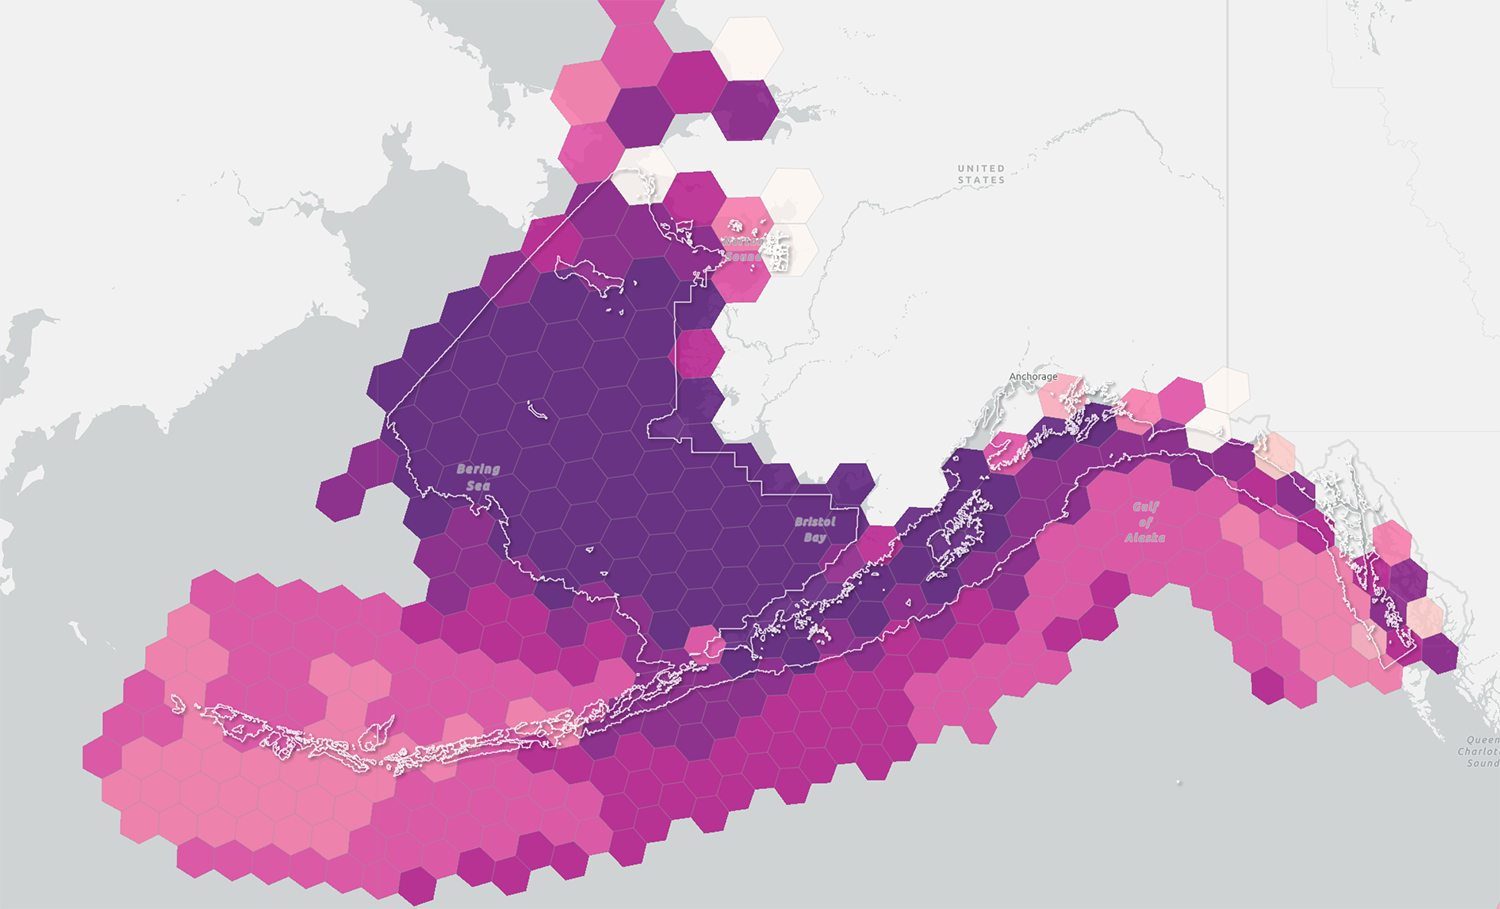
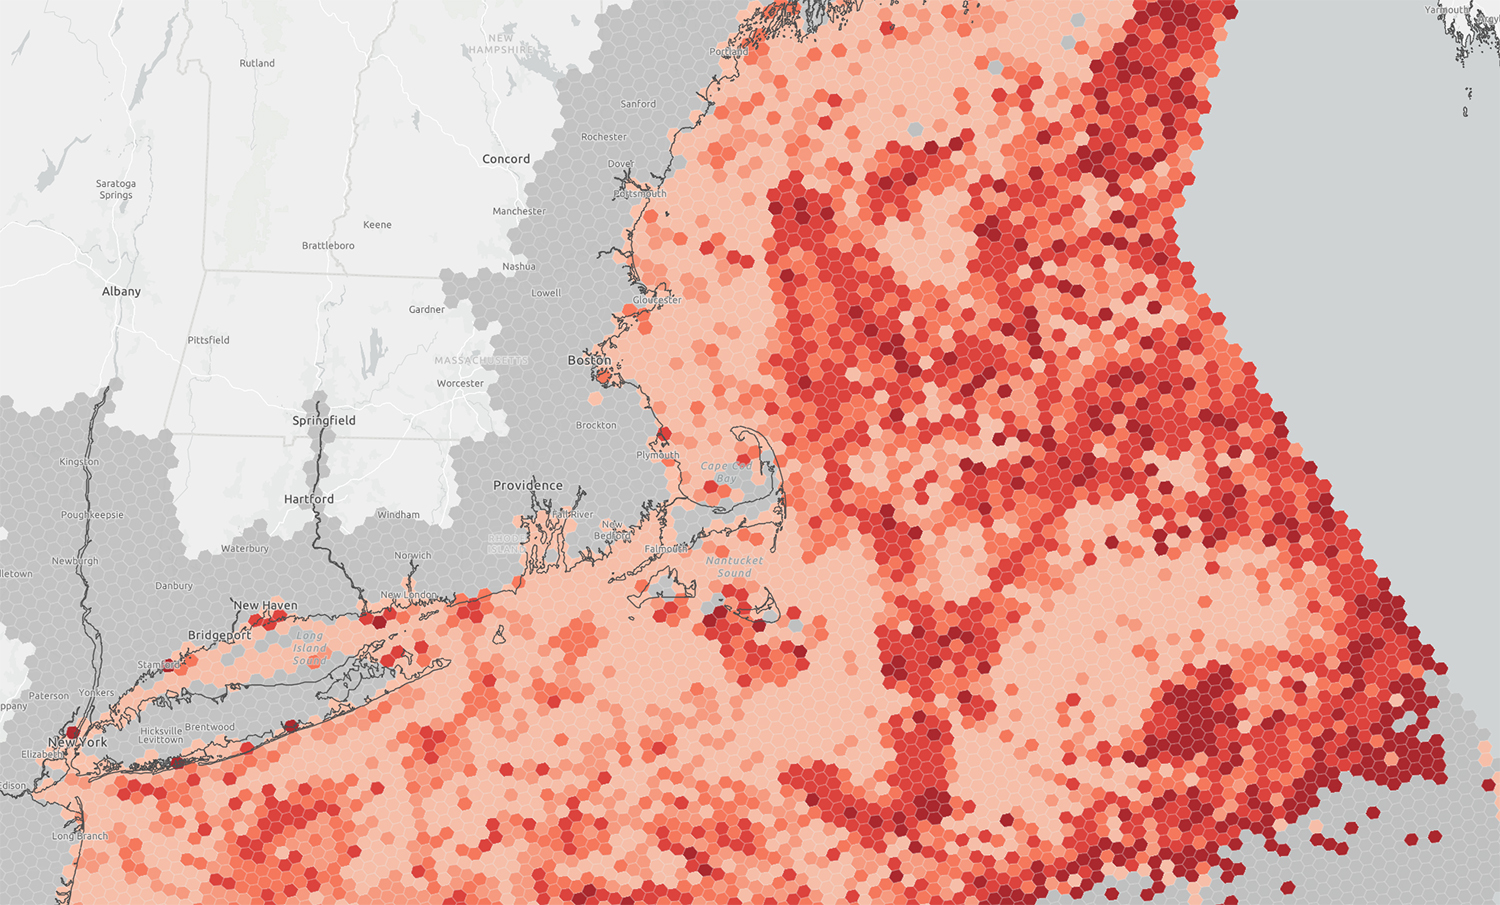
“GIS technology has been incredibly valuable for fisheries,” said Pisut. “As an example, NOAA Fisheries’ Distribution Mapping and Analysis Portal (DisMAP) tracks the location range of fisheries stocks, making it possible to use the data to document the northward shift of American lobster, most likely the result of warming ocean temperatures. Mapping and understanding these patterns – or modelling them – provides the industry with time to adjust. We see our new platform as a new type of marine spatial planning for the blue economy.”
Pisut adds that GIS is a way to integrate a range of necessary information for productive fisheries, such as species and biodiversity observations from the federal government, or points that can inform fisheries’ understanding of particular habitats now and in the future. Being able to translate this type of data into GIS technology and make it available, not just for fisheries but for all ocean stakeholders, has generated plenty of positive feedback.
For now, the work will be centralized to the United States, with the initial scope being all areas within the country’s Exclusive Economic Zone. However, with data available globally, the ultimate goal is to extend the platform to other regions. Hopes are high that fisheries themselves will be able to add to the platform, bringing creativity and new ways to easily integrate information or combine variables into a new index that helps to inform policy.
“We’re looking at a semi-public release of the prototype in early 2025,” said Pisut. “Our goal is to make things easier for stakeholders. Their jobs are hard enough, so the data shouldn’t be. We want to make data more understandable, add value, republish data in a meaningful way and open up opportunities in other areas, such as AI assistance, to vary information or be able to extract, interpret or generate new details.”
Now that you've reached the end of the article ...
… please consider supporting GSA’s mission to advance responsible seafood practices through education, advocacy and third-party assurances. The Advocate aims to document the evolution of responsible seafood practices and share the expansive knowledge of our vast network of contributors.
By becoming a Global Seafood Alliance member, you’re ensuring that all of the pre-competitive work we do through member benefits, resources and events can continue. Individual membership costs just $50 a year.
Not a GSA member? Join us.
Author
-

Correspondent Bonnie Waycott became interested in marine life after learning to snorkel on the Sea of Japan coast near her mother’s hometown. She specializes in aquaculture and fisheries with a particular focus on Japan, and has a keen interest in Tohoku’s aquaculture recovery following the 2011 Great East Japan Earthquake and Tsunami.
Related Posts
Fisheries
GPS data may identify potential IUU fishing behavior
A study led by Global Fishing Watch provides new insight into potential IUU fishing behavior that could help improve fisheries management.
Innovation & Investment
Canadian ‘climate action’ company to test its green gravel for kelp forest restoration
Cascadia Seaweed, a British Columbia-based climate-action company, will test its kelp forest-restoration technology this summer off the coast of Nova Scotia.
Fisheries
Amid warnings, some marine species exhibit climate resilience as oceans warm
Warming oceans are causing major changes, yet some fish species, where the waters are most in flux, are showing climate resilience.
Fisheries
Artificial intelligence is already helping improve fisheries, but the trick is in training the tech
Artificial intelligence is providing valuable data to fisheries, cutting costs and the need for human review. Can the technology be perfected?