Variation in size can be due to nursery stocking density
Accurate estimation of the number of shrimp in a culture unit is critical for managers to administer appropriate feed rations and predict harvest size. If the population is underestimated, the animals will be underfed, leading to poor growth. If the system is overfed due to an overestimation of the population, unnecessary nutrients can cause oxygen depletion and toxic inorganic nitrogen accumulation, in addition to significant economic losses caused by wasted feed.
To estimate the population size of a growout system, an accurate approximation of the number of shrimp stocked must first be made. One of the advantages to operating a nursery prior to the grow-out cycle is that the number of shrimp can be reassessed between the two stages. The mean weight of multiple groups of shrimp is commonly used to determine the quantity of shrimp, by weight, needed to stock at a particular density. However, knowing the number of samples needed to overcome nursery size variability and arrive at a statistically sound approximation of the weight needed can substantially increase accuracy.
Shrimp sampling method
To arrive at an accurate estimate of shrimp weight, a statistics-based sequential sampling method is routinely used at the Gulf Coast Research Laboratory in Mississippi, USA, and the Waddell Mariculture Center in South Carolina, USA. Groups of animals from all areas of the nursery are collected, and care is taken to avoid crowding animals in nets.
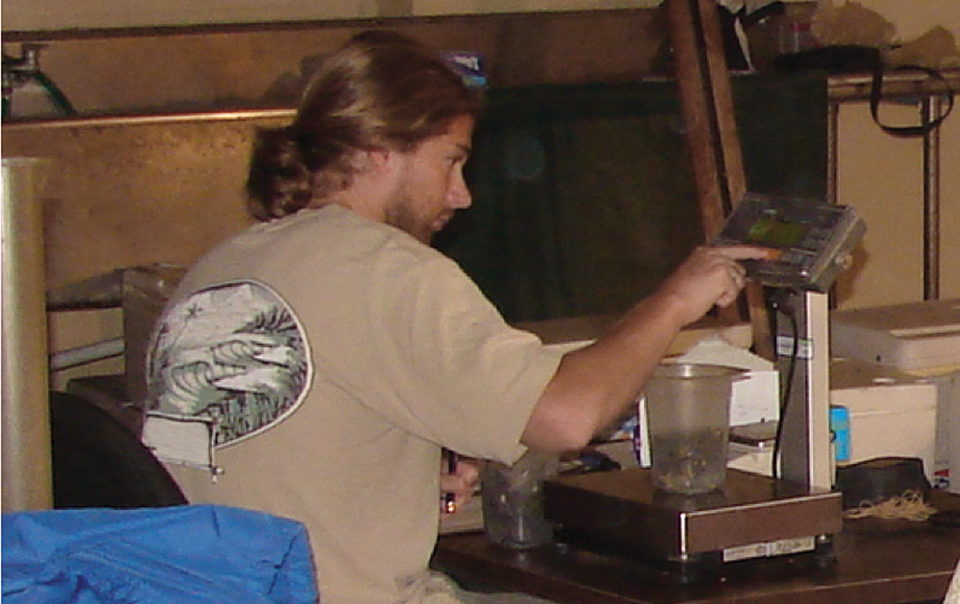
Approximately 200 animals are included in each sample. Samples are then carefully weighed, and the exact numbers of shrimp are counted. The sample weight and number of shrimp in each sample are recorded in an electronic spreadsheet. The formulas used to calculate each subsequent value are preprogrammed into the spreadsheet before sampling begins. A completed example spreadsheet file is depicted in Table 1.
Ray, Typical organization for a spreadsheet, Table 1
| Sample Number | Weight (g) | Number of Shrimp | Shrimp/g | Cumulative Mean Shrimp/g | Standard Deviation | Standard Error | Confidence Bound | Confidence Bound CB/Mean |
|---|
Sample Number | Weight (g) | Number of Shrimp | Shrimp/g | Cumulative Mean Shrimp/g | Standard Deviation | Standard Error | Confidence Bound | Confidence Bound CB/Mean |
|---|---|---|---|---|---|---|---|---|
| 1 | 215.6 | 277 | 1.285 | |||||
| 2 | 202.6 | 270 | 1.333 | 1.309 | 0.034 | 0.024 | 0.304 | 0.232 |
| 3 | 200.1 | 274 | 1.369 | 1.329 | 0.042 | 0.024 | 0.105 | 0.079 |
| 4 | 206.8 | 200 | 0.967 | 1.238 | 0.184 | 0.092 | 0.293 | 0.237 |
| 5 | 204.1 | 258 | 1.264 | 1.244 | 0.160 | 0.072 | 0.199 | 0.160 |
| 6 | 200.0 | 252 | 1.260 | 1.246 | 0.143 | 0.058 | 0.150 | 0.121 |
| 7 | 205.3 | 226 | 1.101 | 1.226 | 0.142 | 0.054 | 0.131 | 0.107 |
| 8 | 201.8 | 262 | 1.298 | 1.235 | 0.134 | 0.047 | 0.112 | 0.091 |
| 9 | 203.4 | 283 | 1.391 | 1.252 | 0.136 | 0.045 | 0.104 | 0.083 |
| 10 | 207.2 | 306 | 1.477 | 1.275 | 0.146 | 0.046 | 0.105 | 0.082 |
| 11 | 214.9 | 287 | 1.336 | 1.280 | 0.140 | 0.042 | 0.094 | 0.073 |
| 12 | 206.2 | 267 | 1.295 | 1.281 | 0.134 | 0.039 | 0.085 | 0.066 |
| 13 | 202.7 | 251 | 1.238 | 1.278 | 0.128 | 0.036 | 0.078 | 0.061 |
| 14 | 203.5 | 260 | 1.278 | 1.278 | 0.123 | 0.033 | 0.071 | 0.056 |
| 15 | 217.4 | 291 | 1.339 | 1.282 | 0.120 | 0.031 | 0.066 | 0.052 |
From the number of shrimp in each sample and the weight of that sample, a shrimp per gram value is calculated. In the following column, a cumulative mean shrimp per gram value is calculated with each new sample. From that, standard deviation and standard error values are calculated as in equation 1 in Fig. 1. The standard error value is used in equation 2 to calculate the confidence bound (C.B.). The C.B. is then divided by the latest cumulative mean value to determine whether the limits of the C.B. are within 5 percent of the mean.
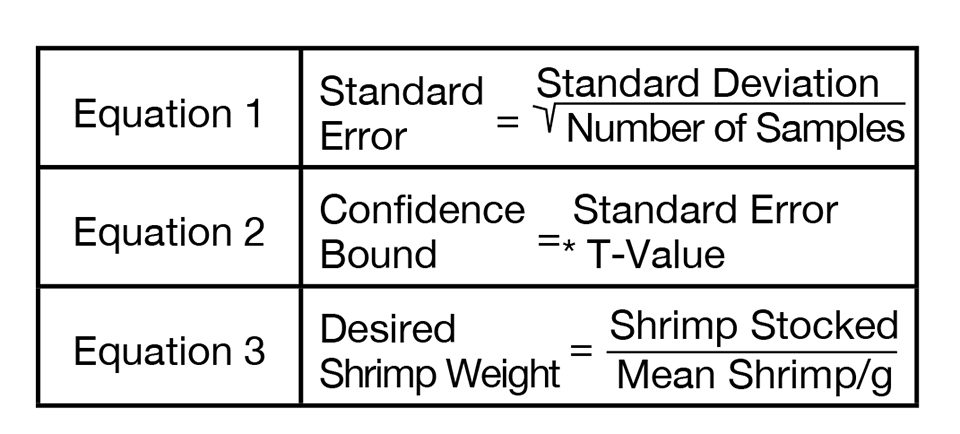
The t-value used in equation 2 (Fig. 1) to calculate the C.B. comes from a table of t-distributions typically found in statistics books. The value needed is from a two-tale t-distribution where α = 0.05. The t-value used depends on the number of samples weighed, where degrees of freedom = N-1. The t-values are presented in Table 2.
Ray, αT-values used to calculate confidence, Table 1
| Degrees of Freedom | T-Value (two-tale, α = 0.05 |
|---|
Degrees of Freedom | T-Value (two-tale, α = 0.05 |
|---|---|
| 1 | 12.706 |
| 2 | 4.303 |
| 3 | 3.182 |
| 4 | 2.776 |
| 5 | 2.571 |
| 6 | 2.447 |
| 7 | 2.365 |
| 8 | 2.306 |
| 9 | 2.262 |
| 10 | 2.228 |
| 11 | 2.201 |
| 12 | 2.179 |
| 13 | 2.160 |
| 14 | 2.145 |
| 15 | 2.132 |
| 16 | 2.120 |
| 17 | 2.110 |
| 18 | 2.101 |
| 19 | 2.093 |
| 20 | 2.086 |
| 21 | 2.080 |
| 22 | 2.074 |
| 23 | 2.069 |
| 24 | 2.064 |
| 25 | 2.060 |
| 26 | 2.056 |
| 27 | 2.052 |
| 28 | 2.048 |
| 29 | 2.045 |
| 30 | 2.042 |
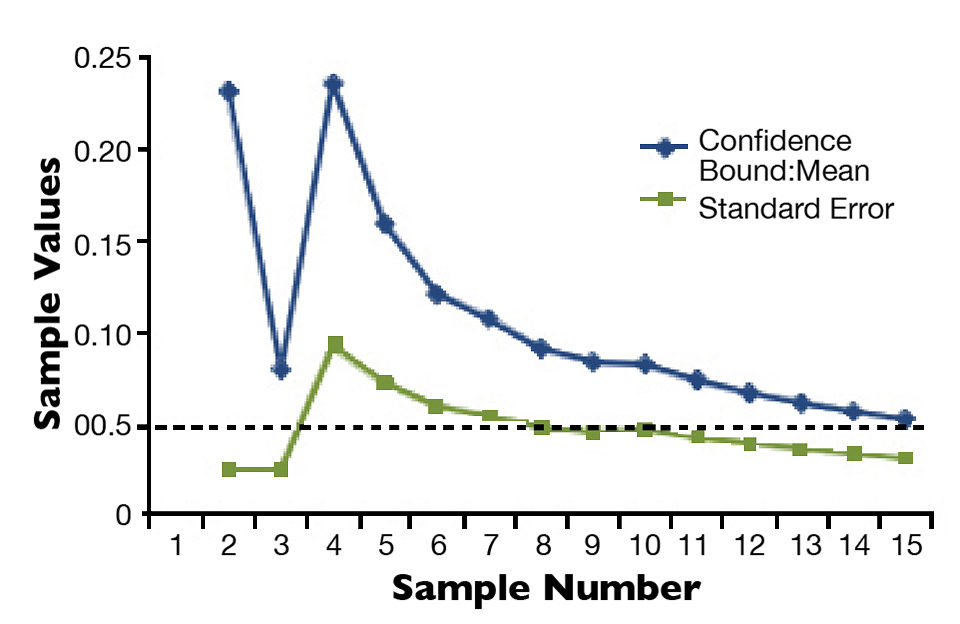
When at least 10 samples have been measured, and the C.B.:mean ratio is 0.05 or less, that latest cumulative mean value is accepted. Shrimp can then be stocked by weight using equation 3 (Fig. 1), with the accuracy of the number of shrimp stocked within 5 percent (Fig. 2). For example, using the data in Table 1, if a system manager would like to stock 50,000 animals from the sampled nursery, 39,001.6 g of shrimp (50,000/1.282) are needed.
Size variability, stocking density
To assess whether variation in shrimp size at the end of a nursery phase can be attributed to nursery stocking density, the authors examined data from 15 recent nursery harvests at the Waddell Mariculture Center. They compared the coefficient of variation in the size of shrimp at the time of nursery harvest to the original stocking density of those respective nurseries.
Using regression analysis, it was determined that stocking density was a strong predictor of the coefficient of variation in shrimp weight. This finding implies that with higher stocking density comes greater size variability when nurseries are harvested.
Perspectives
By sampling a nursery system in the manner described, the statistical confidence bounds around the mean shrimp weight are monitored closely as samples are collected. This allows a system manager to arrive at a point in sampling where 95 percent confidence bounds around the mean are established.
This project demonstrated that the amount of variation in shrimp size can be a product of the nursery stocking density. This may be an important consideration in determining the number of shrimp that should be stocked into a nursery system.
Stocking shrimp of uniform size reduces the initial variability of growout systems. It should be evaluated whether this reduction in variability results in a decrease of size variability at the end of the production cycle.
(Editor’s Note: This article was originally published in the July/August 2011 print edition of the Global Aquaculture Advocate.)
Authors
-
Andrew J. Ray, M.S.
University of Southern Mississippi
Gulf Coast Research Laboratory
703 East Beach Drive
Ocean Springs, Mississippi 39564 USA -
Jeffrey M. Lotz, Ph.D.
University of Southern Mississippi
Gulf Coast Research Laboratory
703 East Beach Drive
Ocean Springs, Mississippi 39564 USA -
Jeffrey F. Brunson, M.S.
South Carolina Department of Natural Resources
Waddell Mariculture Center
Bluffton, South Carolina, USA -
John W. Leffler, Ph.D.
South Carolina Department of Natural Resources
Waddell Mariculture Center
Bluffton, South Carolina, USA
Tagged With
Related Posts
Health & Welfare
A comprehensive look at the Proficiency Test for farmed shrimp
The University of Arizona Aquaculture Pathology Laboratory has carried out the Proficiency Test (PT) since 2005, with 300-plus diagnostic laboratories participating while improving their capabilities in the diagnosis of several shrimp pathogens.
Health & Welfare
A study of Zoea-2 Syndrome in hatcheries in India, part 1
Indian shrimp hatcheries have experienced larval mortality in the zoea-2 stage, with molt deterioration and resulting in heavy mortality. Authors investigated the problem holistically.
Innovation & Investment
Acoustic control improves feeding productivity at shrimp farms
In systems recently developed for shrimp farms, passive acoustic-based technology enables sensor-based control of multiple automatic feeders. Improved growth and feed conversion have been recorded at commercial farms using the technology.
Health & Welfare
Asepsis key to prevent contamination in shrimp hatcheries
Maintaining biosecurity and asepsis in larval shrimp production is a key component of the production chain in Ecuador, which requires the production of 5.5 billion larvae monthly from 300-plus hatcheries.


