Which is better for the farmer: older or bigger?
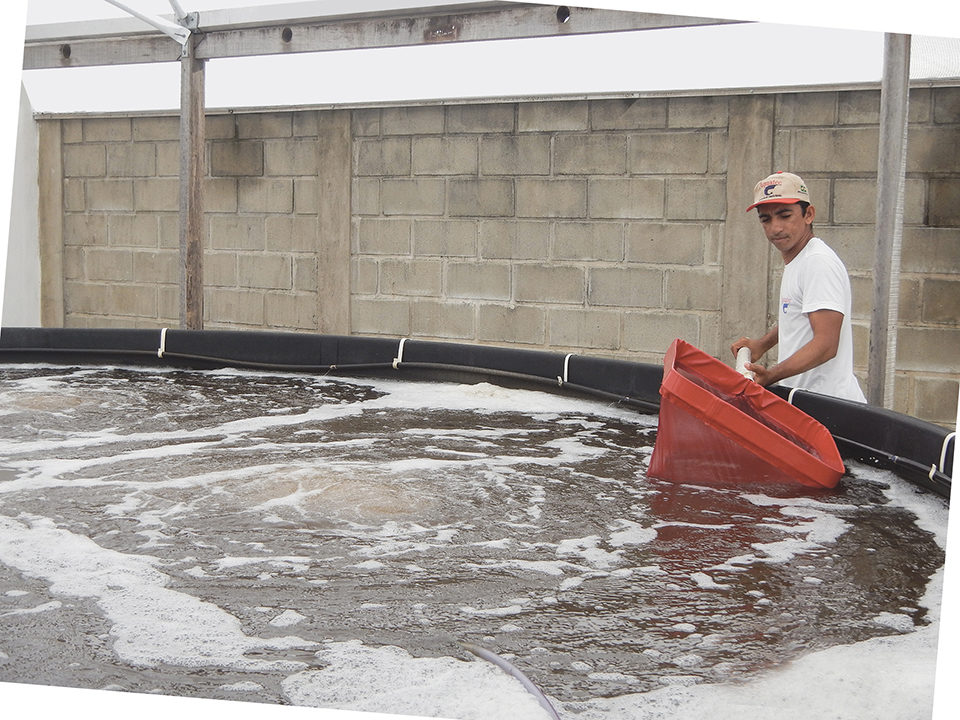
Whenever someone asks a shrimp farmer, what is the size of your shrimp, the answer usually comes back as the weight of the animals (e.g., 7 g, 15 g, 20 g). Why, then, is the size of shrimp postlarvae described in age (e.g., P.L.10, P.L.15, P.L.20)?
Usually, the “size” of postlarvae in the market is considered their chronological age after completing the metamorphosis period. A P.L.10, for example, is an animal that went through complete metamorphosis (involving nauplii, zoea and mysis stages) and has been a postlarva for 10 days. At this point, the animal has completed its morphological and physiological development, and the standard larval-rearing process would be finished.
Changes in commercial postlarvae
Factors such as species adaptation, genetic improvement, diversification and modernization in production have led to significant advances in the Pacific white shrimp (Litopenaeus vannamei) postlarvae that arrive on shrimp farms from commercial hatcheries in Brazil. The P.L.10 from 20 years ago is definitely not the same product seen today.
Not only have there been changes in the P.L.10, the product most used by Brazilian shrimp farmers, but in the last five years, there were also changes in market demand. A demand for product diversification has called for acclimation of postlarvae to extreme salinities from 0 to 70 ppt and with ionic balance. Postlarvae with higher size uniformity and/or fast initial growth are sought, as well as “older” postlarvae.
These “older” postlarvae are the product of an extended rearing period, which can reach up to 30 days. In general, the farmer who works with this product is looking for stronger seedstock, which can bring more tolerance of stocking management and higher weight gain during the first days in the pond. The latter is of huge importance to farmers affected by white spot syndrome and those producers who don’t have nursery facilities at their farms.
To provide some perspective on this market, Aquatec Aquacultura Ltda. launched its P.L.20 product in January 2009. Since then, it has sold more than 1.5 billion P.L.20, and 500 million P.L.15, effectively supplying an increasing regional demand.
Products like the P.L.20 reflect the modernization of larval rearing, especially when it comes to size. That is because after P.L.10, the animals enter another rearing phase inside the hatchery that is mainly focused on weight gain.
Facing so many changes, questions continue to arise: Should we continue to identify postlarvae merely by chronological age? Does this provide the most important information to shrimp farmers?
Identifying size
Although age has been an internationally established method for identifying postlarvae since the beginning of marine shrimp commercial hatcheries, this information alone ignores the particularities of postlarvae of the same age but from different origins and production management techniques. In addition to age, information such as length and weight – as well as their mathematical relationship – are recognized to be of vital importance in aquaculture science.
Aiming to better understand the growth pattern of “older” postlarvae and the influence of three culture systems on their development, the authors analyzed biometric data for 480 P.L.15 to P.L.22 postlarvae from Aquatec’s Speedline-HB12 lineage collected between February 2013 and February 2014.
Growth: P.L.15 to P.L.22
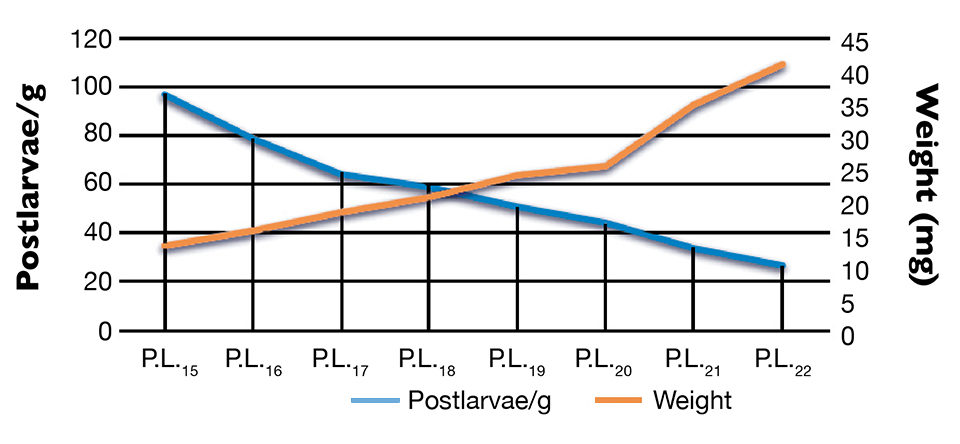
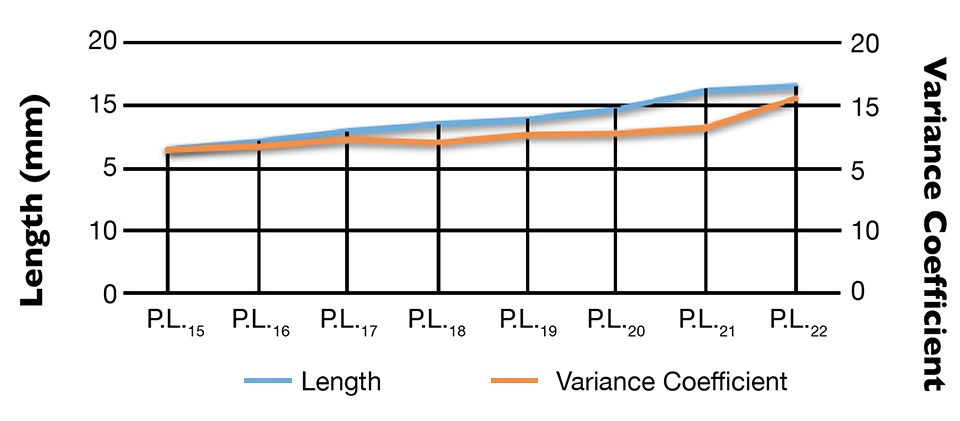
Fig. 1 shows the growth curve for P.L.15 to P.L.22, on which a breakpoint for weight gain appears at P.L.20. Figure 2 shows the growth curve on length and information on the variance coefficient, illustrating uniformity along with growth. As indicated on the second curve, uniformity decreases as age increases. In addition, the gains in length are smaller than the gains in weight, confirming the idea that at this stage, animals are more in a process of weight gain than physiological development.
The next step was to cross the information above with different seasons and cultures systems, analyzing the influence of these factors on the animals’ performance. This study used the Fulton’s condition factor, a measure of fish health that assumes the standard weight of a fish is proportional to the cube of its length.
Seasonal effects
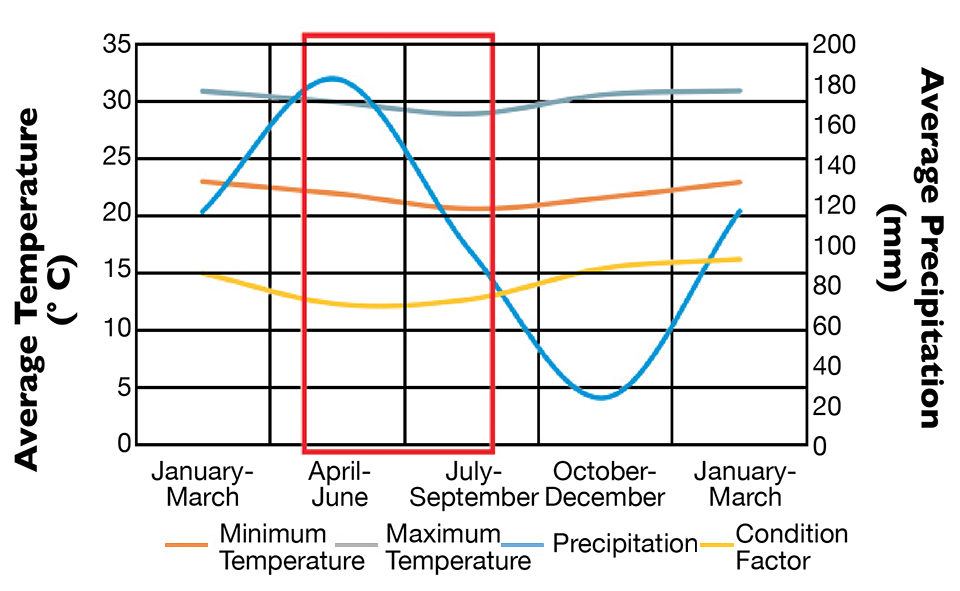
In the graphs of the parameters analyzed during five, three-month periods between February 2013 and March 2014, greater differences are observed among ages in weight than in length. On the other hand, the similarity of the condition factors along the seasons for all ages is remarkable. They all present an average decrease of 18 percent in the second trimester, followed by recovery during the next three trimesters of 4, 22 and 5 percent.
The average historical climate data for each trimester is also plotted in Fig. 3. The months with maximum precipitation and minimum temperatures are identified by the red rectangle.
Effects of culture system
To study the effects of the culture system, the data was divided into three systems, as shown in Table 1. It is important to emphasize that the results from each system is a sum of effects from the rearing environment and rearing facility (type of tank; aeration system; water entrance, drainage and movement) plus management (which includes as main differentials the preparation and maintenance of the tank and water, along with feeding).
Teixeira, Description of the three systems evaluated, Table 1
| Culture System | Tank Type |
|---|
Culture System | Tank Type |
|---|---|
| Open | Tanks, 13-m³ |
| Greenhouse | Raceways. 45-m³ |
| Greenhouse | Round tanks, 30-m³ |
It is also important to consider the order in which the authors worked with each system, presented on the table. The changes from one system to another came due to production demand, but also while searching for improvement of the zootechnical results and production line efficiency.
Comparing the three systems (now considering days of hatchery and no longer age, Fig. 4), the animals cultivated in greenhouse-covered tanks had the best performance. To verify the conditions under which the animals where reaching this higher productivity, the condition factor was calculated for each hatchery day for the three systems, with the greenhouse tanks still having the best results.
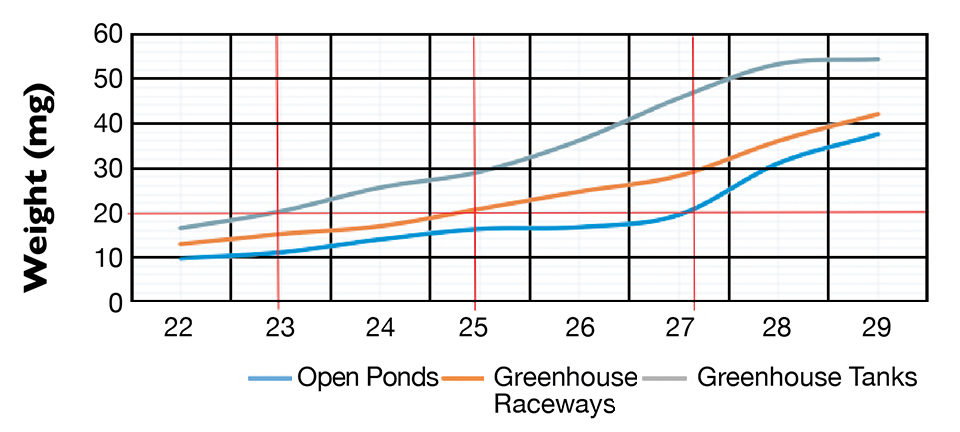
Randomly selecting a fixed weight of 20 mg under the greenhouse tank system, this weight could be reached in 23 days, while it took 25 and 27 days under the raceway and tank systems, respectively, for shrimp to reach 20 mg. This means that with changes and adaptations in infrastructure and management, it was possible to “gain” four days of production while maintaining average survivals near 100 percent.
This makes the initial question even more intriguing: Is age, by itself, enough to identify the animals we stock in grow-out ponds?
New concept to consider
This study showed there can be P.L.20 weighing from 19 to 45 mg, which is the same as saying 53-22 P.L./g. Same age, but different sizes/weights. Which is better for the farmer: older or bigger?
As pioneers in the marketing of P.L.20 in Brazil with 25 years of experience selling marine shrimp postlarvae, Aquatec Aquacultura Ltda. believes that after the age of P.L.10, the expression of the size of shrimp postlarvae is more relevant by weight than by chronological age.
Based on this concept, the company has been selling new “jumbo” postlarvae since March 2013. The shrimp, which have an average weight of 16 mg and reflect a range of 50-80 animals/gram, are all produced in greenhouse-covered tanks. Some of the shrimp have reached even higher average weights than the ones described in this article. The authors therefore believe this may be a new step for the Brazilian shrimp-farming industry that improves the relationship between hatcheries and farms.
(Editor’s Note: This article was originally published in the September/October 2014 print edition of the Global Aquaculture Advocate.)
Authors
-
Ana Paula G. Teixeira
Aquatec Aquacultura Ltda.
Av. do Pontal, s/n – Barra de Cunhaú
Canguaretama/R.N. – Brasil 59.190-000 -
Ana Carolina B. Guerrelhas
Aquatec Aquacultura Ltda.
Av. do Pontal, s/n – Barra de Cunhaú
Canguaretama/R.N. – Brasil 59.190-000
Tagged With
Related Posts
Health & Welfare
Acclimating shrimp postlarvae before pond stocking
Shrimp postlarvae acclimation before stocking into the various growout systems (ponds, raceways, tanks) is a critical – and often overlooked, sometimes taken for granted – step in the shrimp culture process. Various water quality parameters should be changed slowly so that the young shrimp have the time to gradually adapt to the new conditions.
Aquafeeds
Biofloc consumption by Pacific white shrimp postlarvae
The stable isotopes technique with δ13C and δ15N can be used to determine the relevance of different food sources to shrimp feeding during the pre-nursery phase of Litopenaeus vannamei culture. During this trial, different types of commercial feed, microalgae, Artemia sp. nauplii and bioflocs were used as food sources.
Health & Welfare
A comprehensive look at the Proficiency Test for farmed shrimp
The University of Arizona Aquaculture Pathology Laboratory has carried out the Proficiency Test (PT) since 2005, with 300-plus diagnostic laboratories participating while improving their capabilities in the diagnosis of several shrimp pathogens.
Innovation & Investment
Algae innovators aim to freeze out early-stage shrimp losses
A greenhouse in Belgium believes its innovative shrimp feed product, made from freeze-dried microalgae, packs the necessary nutrients for the crustacean’s most vulnerable life stage: the first three days of its life.


