Reducing algae grazing provides more reliable results
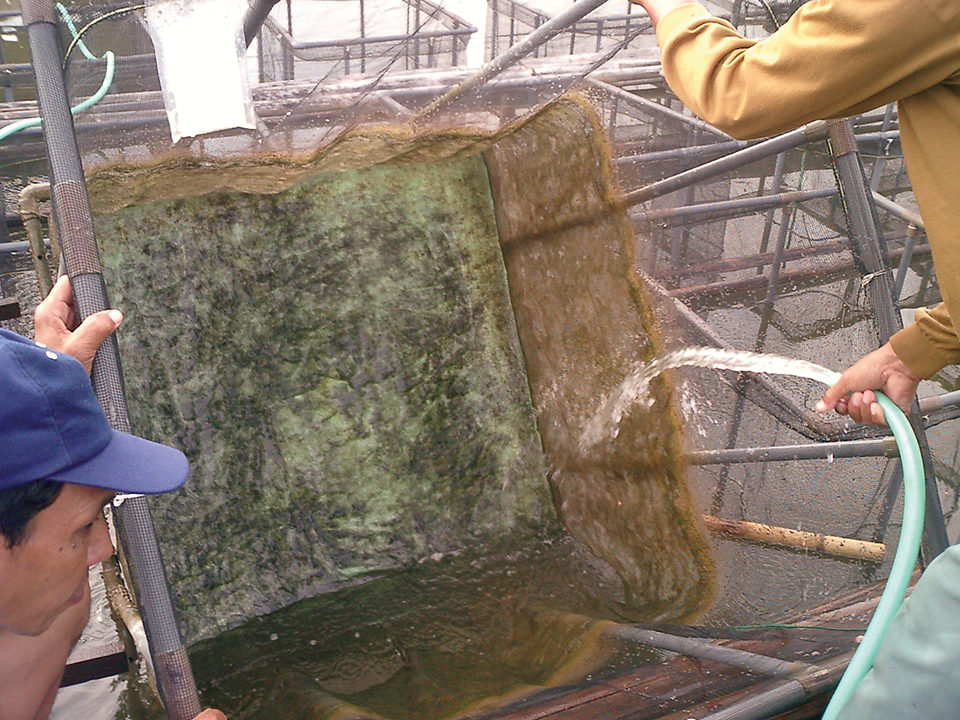
Feeding trials for shrimp performed in clearwater systems are an excellent method to determine nutritional requirements for these species. But testing in such environments is significantly different from the practical grow-out situation in a pond. Shrimp in clearwater systems solely depend on artificial diets, while shrimp in ponds can also feed on naturally occurring feed organisms.
Nutritional grow-out experiments should preferably be done in ponds, but pond experiments are expensive and usually limited in number of treatments or replicates. An acceptable compromise is performing experiments in separated cages within a pond. In this way, the experiments are executed in a realistic pond environment while keeping the testing on a small scale.
Algae influence
Yet in such trials, growth differences in shrimp fed high-quality versus standard diets are not always evident. A possible explanation is the fact that in small cages, shrimp have easy and abundant access to the algae growing on the pen walls. By grazing these algae, the shrimp feed themselves, resulting in unreliable experimental results.
An attempt by the authors to reduce this effect by regularly cleaning the pens resulted in no change. In addition, cleaning was difficult to perform, and the pen surfaces were quickly recolonized by algae.
Another approach is to enlarge the pens to reduce the shrimp’s access to the algae. Based on this idea, the authors set up a trial to compare the growth of shrimp fed a high-performance or standard feed in small versus big pens.
Cage trial
The experimental setup consisted of six 1-cubic-meter mesh pens and six 3- x 3- x 1-meter mesh pens supported by a bamboo construction that left about 15 cm between the cage bottoms and pond bottom. The net pens were stocked with 20 Penaeus monodon juveniles of 0.58 ± 0.07 grams initial weight per square meter.
Two diets were formulated (Table 1). Besides higher protein and fat content, the high-performance (H.P.) diet had an extra nutrient premix to promote growth and more fishmeal than the standard diet. In the H.P. feed, 60 percent of the protein was from fishmeal, while standard had only 40 percent fishmeal protein. The STD diet resembled an extensive grow-out diet, whereas the H.P. diet was more comparable to an intensive grow-out diet.
Ceulemans, Proximate composition of experimental feeds, Table 1
| High-Performance Diet | Standard Diet |
|---|
High-Performance Diet | Standard Diet | |
|---|---|---|
| Crude protein | 43.4% | 36.4% |
| Crude fiber | 2.6% | 2.7% |
| Crude fat | 7.0% | 6.5% |
| Ash | 9.8% | 7.2% |
| Dry matter | 90.3% | 90.3% |
All feeds were produced with the same batches of raw materials to avoid variability and pelletized. A premix was added to fulfill the requirements for vitamins, minerals and trace elements for the culture species.
In triplicate pens, the diets were fed to the shrimp at an average of 11.5 percent of body weight in four feedings/day. The trial lasted 10 weeks, following one week of acclimatization.
Every two weeks, all shrimp were group weighed in the small pen system. In the big pens, 25 animals were randomly collected and weighed, and survival was estimated. During final sampling, all animals were individually weighed and counted. Water temperature, salinity and dissolved-oxygen levels were measured daily.
Results
Table 2 provides an overview of the results. Because uneaten feed was not collected for feed intake correction, and shrimp were overfed, feed-conversion values are not representative. No abnormalities were observed during the trial.
Ceulemans, Composition of Nile tilapia fed diets, Table 2
| Big Pen, H.P. Diet | Big Pen, STD Diet | p | Small Pen, H.P. Diet | Small Pen, STD Diet | p |
|---|
Big Pen, H.P. Diet | Big Pen, STD Diet | p | Small Pen, H.P. Diet | Small Pen, STD Diet | p | |
|---|---|---|---|---|---|---|
| Survival (%) | 70.0 ± 2.2 | 74.0 ± 3.0 | 0.151 | 92.0 ± 5.8 | 68.0 ± 11.0 | 0.035 |
| Initial weight (g) | 0.58 ± 0.02 | 0.59 ± 0.01 | 0.448 | 0.57 ± 0.02 | 0.58 ± 0.01 | 0.630 |
| Final weight (g) | 9.87 ± 0.39 | 7.97 ± 0.25 | 0.002 | 8.89 ± 0.51 | 9.57 ± 0.21 | 0.104 |
| Specific growth rate (%/day) | 4.05 ± 0.02 | 3.72 ± 0.08 | 0.002 | 3.93 ± 0.10 | 4.02 ± 0.05 | 0.251 |
| Feed intake (% body weight/day) | 11.5 ± 0.2 | 11.3 ± 1.0 | 0.767 | 11.9 ± 0.8 | 12.2 ± 0.6 | 0.641 |
| Feed-conversion ratio | 4.54 ± 0.09 | 4.61 ± 0.46 | 0.821 | 4.75 ± 0.3 | 4.83 ± 0.25 | 0.733 |
| Big Pen, H.P. Diet | Small Pen, H.P. Diet | p | Big Pen, STD Diet | Small Pen, STD Diet | p | |
| Survival (%) | 70.0 ± 2.2 | 92.0 ± 5.8 | 0.004 | 74.0 ± 3.0 | 68.0 ± 11.0 | 0.494 |
| Initial weight (g) | 0.58 ± 0.02 | 0.57 ± 0.02 | 0.441 | 0.59 ± 0.01 | 0.58 ± 0.01 | 0.190 |
| Final weight (g) | 9.87 ± 0.39 | 8.89 ± 0.51 | 0.059 | 7.97 ± 0.25 | 9.57 ± 0.21 | 0.001 |
Overall growth in the smaller pens was good and in line with similar trials. No significant differences were observed between diet treatments in this group, except survival, which was mainly caused by the higher mortality in one cage. The standard diet performed better than the H.P. diet, although this was not significant. This confirmed previous findings that it is difficult to find growth differences between shrimp fed high-performance or standard diets in small cages.
In the larger pens, about 9 percent better growth and 24 percent higher final individual weight were observed for the H.P. group compared with the standard group, as would be expected.
There was no significant growth difference between shrimp that received the H.P. feed in the different cage sizes. However, the shrimp fed the standard diet grew significantly better in the small cages, suggesting that in the small pens the shrimp could compensate for the lesser-quality standard diet by grazing on the algae growing on the surfaces of the net cages.
(Editor’s Note: This article was originally published in the May/June 2008 print edition of the Global Aquaculture Advocate.)
Now that you've reached the end of the article ...
… please consider supporting GSA’s mission to advance responsible seafood practices through education, advocacy and third-party assurances. The Advocate aims to document the evolution of responsible seafood practices and share the expansive knowledge of our vast network of contributors.
By becoming a Global Seafood Alliance member, you’re ensuring that all of the pre-competitive work we do through member benefits, resources and events can continue. Individual membership costs just $50 a year.
Not a GSA member? Join us.
Authors
-
-
Zaenal Arifin
Brackish Aquaculture Development Center
Jepara, Indonesia
Tagged With
Related Posts
Health & Welfare
A case for better shrimp nutrition
Shrimp farm performance can often be below realistic production standards. Use proven nutrition, feeds and feeding techniques to improve profitability.
Aquafeeds
A look at India’s fish feed industry
India's fish-farming industry makes limited use of modern feeds, providing potential for the feed sector to grow. Commercial feeds are predominantly used for pangasius farming, followed by a rising popularity in carp culture.
Aquafeeds
A look at phospholipids in aquafeeds
Phospholipids are the major constituents of cell membranes and are vital to the normal function of every cell and organ. The inclusion of phospholipids in aquafeeds ensures increased growth, better survival and stress resistance, and prevention of skeletal deformities of larval and juvenile stages of fish and shellfish species.
Health & Welfare
A comprehensive look at the Proficiency Test for farmed shrimp
The University of Arizona Aquaculture Pathology Laboratory has carried out the Proficiency Test (PT) since 2005, with 300-plus diagnostic laboratories participating while improving their capabilities in the diagnosis of several shrimp pathogens.


