Different methods to measure important environmental factor

Electrical conductivity
The ability of water to conduct electricity increases with greater salinity because electricity is conducted through water by free ions. A conductivity meter (Fig. 1) is basically a Wheatstone bridge – traditionally used to measure resistivity – modified to measure the reciprocal of resistivity or conductivity. The unit of resistance traditionally was the ohm, but to avoid using 1/ohm for conductivity, the unit mho (ohm spelled backwards) was adopted. The unit siemen also is used as the unit for conductivity, and 1 micromho/cm is the same as 1 microsiemen/cm. Conductivity increases with greater temperature, but most modern conductivity meters are temperature compensated to read out for 25 degrees-C.
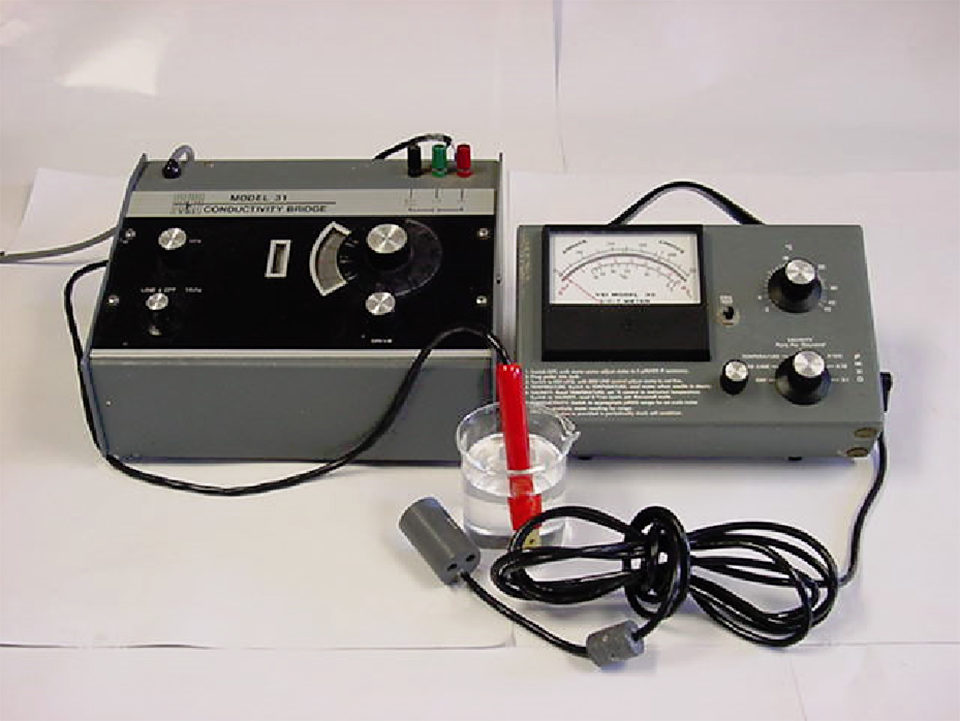
There is a linear relationship between conductivity and salinity. Seawater has a conductivity of about 50,000 mmhos/cm, and half-strength seawater (about 17.25 ppt) has a conductivity of around 25,000 mmhos/cm. Most portable conductivity meters have an option for reading out salinity directly.
https://www.aquaculturealliance.org/advocate/salinity-in-aquaculture-part-1/
Chlorinity
The salinity of seawater was traditionally estimated from Cl– concentration by the Knudsen equation:
Salinity = 1.80655 Cl–
where Cl– (chloride concentration) is in grams per liter. Kits that allow chloride concentration to be measured by titration of water samples with mercuric nitrate are available. Salinity can be estimated accurately from chlorinity in the ocean and in estuaries, but in freshwaters and inland saline waters, the ratio of Cl– to total dissolved substances often differs greatly from that of seawater.
Density
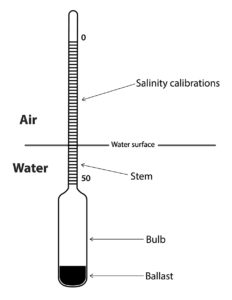
The density of freshwater is about 1 g/mL. Dissolved ions are denser than water and 1 gram of ions displaces less than 1 mL water. As a result, density increases with greater salinity (Table 1). The density of water can be measured with a hydrometer (Fig. 2). A traditional hydrometer is a cylindrical, air-filled bulb, cone-shaped at its bottom with a graduated stem protruding from its top. The bulb contains ballast causing the hydrometer to float upright. The distance that the stem extends above the surface depends upon water density, and the greater the density, the higher the stem rises above the surface. Hydrometers for determining salinity have stems calibrated in salinity units.
Boyd, salinity pt. 2, Table 1
| Degrees-C | Salinity (0 g/L) | Salinity (10 g/L) | Salinity (20 g/L) | Salinity (30 g/L) | Salinity (40 g/L) |
|---|
Degrees-C | Salinity (0 g/L) | Salinity (10 g/L) | Salinity (20 g/L) | Salinity (30 g/L) | Salinity (40 g/L) |
|---|---|---|---|---|---|
| 0 | 0.99984 | 1.0080 | 1.0160 | 1.0241 | 1.0321 |
| 5 | 0.99997 | 1.0079 | 1.0158 | 1.0237 | 1.0316 |
| 10 | 0.00070 | 1.0075 | 1.0153 | 1.0231 | 1.0309 |
| 15 | 0.99910 | 1.0068 | 1.0144 | 1.0221 | 1.0298 |
| 20 | 0.99821 | 1.0058 | 1.0134 | 1.0210 | 1.0286 |
| 25 | 0.99705 | 1.0046 | 1.0121 | 1.0196 | 1.0271 |
| 30 | 0.99565 | 1.0031 | 1.0105 | 1.0180 | 1.0255 |
| 35 | 0.99403 | 1.0014 | 1.0088 | 1.0162 | 1.0237 |
| 40 | 0.99222 | 0.9996 | 1.0069 | 1.0143 | 1.0217 |
Refractive index
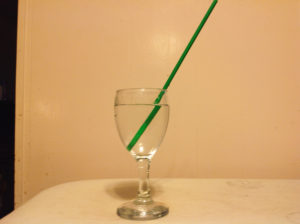
Light travels faster through some media than through others. According to Snell’s law, if the first medium is less dense than the second, light decreases in velocity upon entering the second medium causing it to refract towards the normal. The opposite occurs when light travels faster in the second medium than in the first. The index of refraction is the ratio of the speed of light in a vacuum to the speed of light in a second medium. The refraction of light by water is evident when one views from the side a drinking straw placed in a clear container of water (Fig. 3).
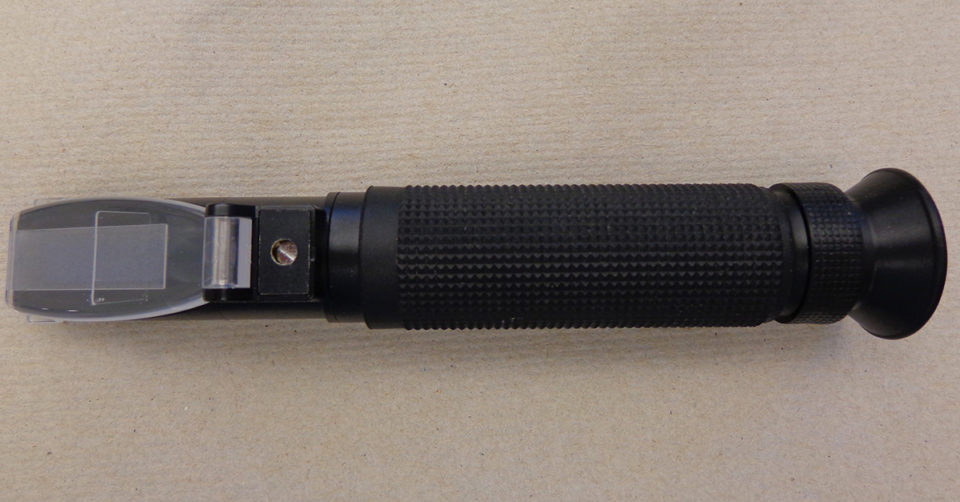
The refractive index of water increases as a function of density, and is influenced also by wavelength of measurement, atmospheric pressure, and temperature. A good quality, handheld, salinity refractometers (Fig. 4) measure salinities of 1 to 60 mg/L to one decimal place. They are widely used to measure salinity at aquaculture facilities supplied with inland, saline water, estuarine water, or seawater.
Salinity and aquaculture
Some aquaculture species such as ictalurid catfish, pangasius and common carp grow best at salinities of <5 g/L; species such as Atlantic salmon, tilapia and rainbow trout grow well up to 20 g/L salinity; estuarine species such as penaeid shrimp grow well at salinities of 2 to 40 g/L. Marine and estuarine species can be farmed in inland saline water, but they may not survive and grow well in spite of adequate salinity. This results from ionic imbalance caused by low concentrations of K+, Mg2+, and Ca2+ or a combination of these cations. Mineral supplements are applied to increase concentrations of major ions.
Boyd, salinity Pt. 2, Table 2
| Salinity | Food energy recovered as fish growth (%) |
|---|
Salinity | Food energy recovered as fish growth (%) |
|---|---|
| 0.5 | 33.4 |
| 2.5 | 31.8 |
| 4.5 | 22.2 |
| 6.5 | 20.1 |
| 8.5 | 10.4 |
| 10.5 | -1.0 |
Source: Wang et al. (1997).
Some freshwaters have very low concentrations of dissolved ions (low salinity), but ion concentration can be increased by liming and adding certain mineral salts. The only practical way of reducing salinity is by adding water of lower salinity to culture systems. This is sometimes done in ponds in arid regions or during prolonged drought. In fish and shrimp hatchery vessels, it is possible to regulate salinity by adding commercially available sea salt mixes of specific salts. Concentrated brine solutions from coastal, seawater evaporation ponds have been added to freshwater to allow inland culture of marine species.
References available from author.
Now that you've reached the end of the article ...
… please consider supporting GSA’s mission to advance responsible seafood practices through education, advocacy and third-party assurances. The Advocate aims to document the evolution of responsible seafood practices and share the expansive knowledge of our vast network of contributors.
By becoming a Global Seafood Alliance member, you’re ensuring that all of the pre-competitive work we do through member benefits, resources and events can continue. Individual membership costs just $50 a year.
Not a GSA member? Join us.
Author
-

Claude E. Boyd, Ph.D.
School of Fisheries, Aquaculture and Aquatic Sciences
Auburn University
Auburn, Alabama 36849 USA
Tagged With
Related Posts
Health & Welfare
Dissolved oxygen dynamics
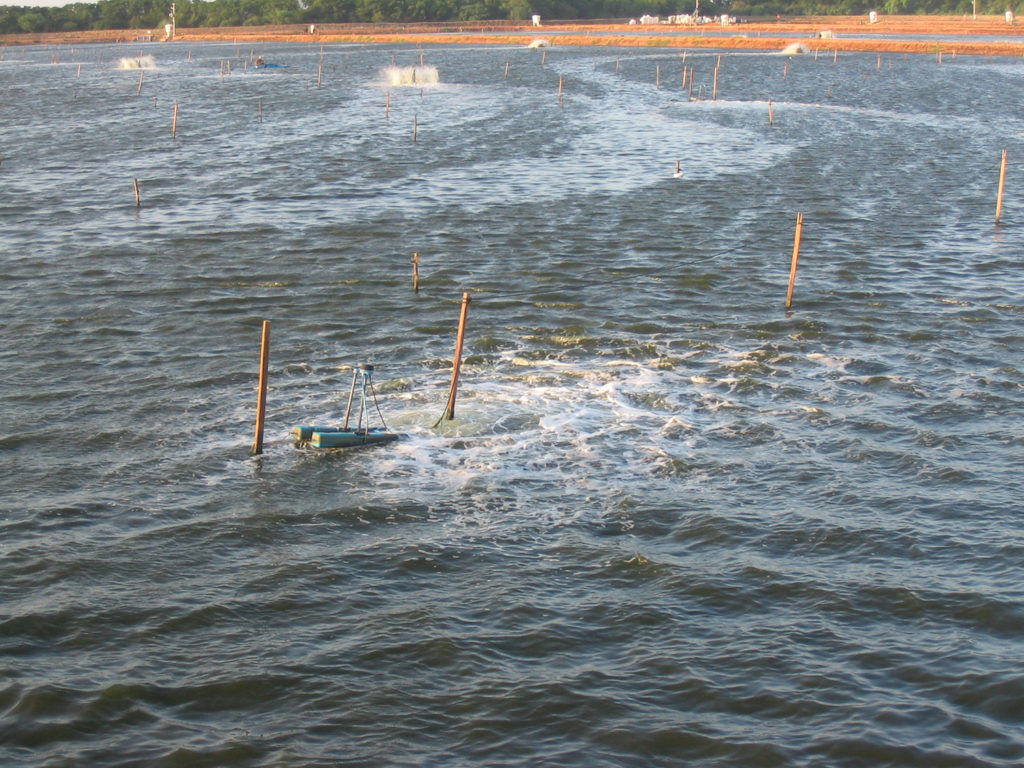
Dissolved oxygen management is the most important requirement of aquaculture pond water quality. DO concentration below 3 mg/L is stressful to shrimp.
Responsibility
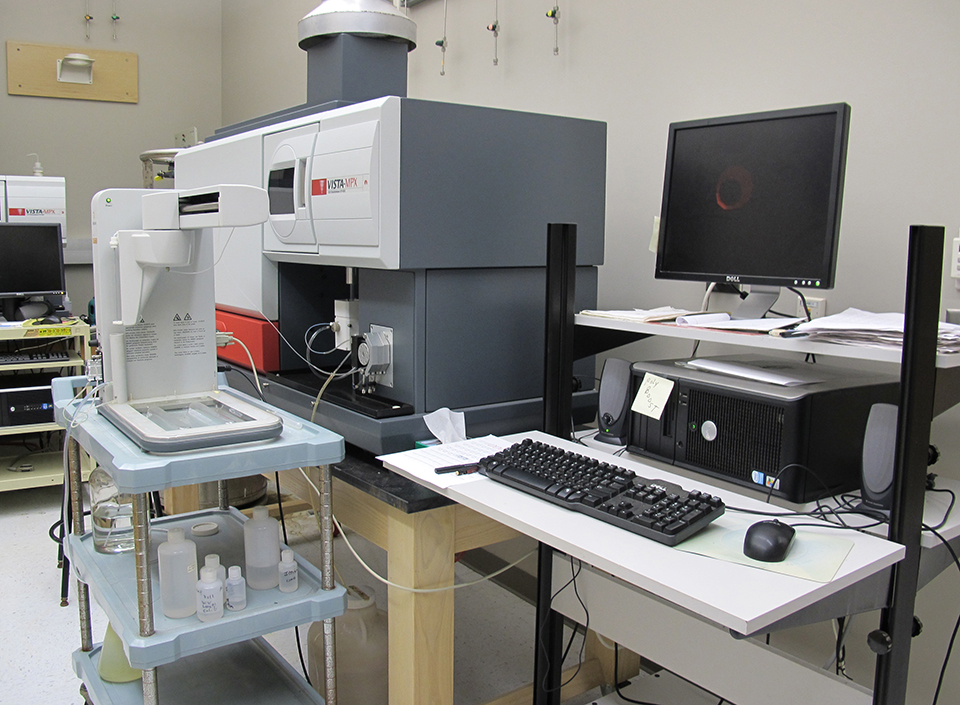
Accuracy of custom water analyses varies
The reliability of trace element analyses reported by custom laboratories cannot be checked by simple techniques, and results may not always be accurate. One should check the reliability of major ion analyses by determining the charge balance and comparing the measured total ion concentration with the total ion concentration estimated from conductivity.
Responsibility
Drying, liming, other treatments disinfect pond bottoms
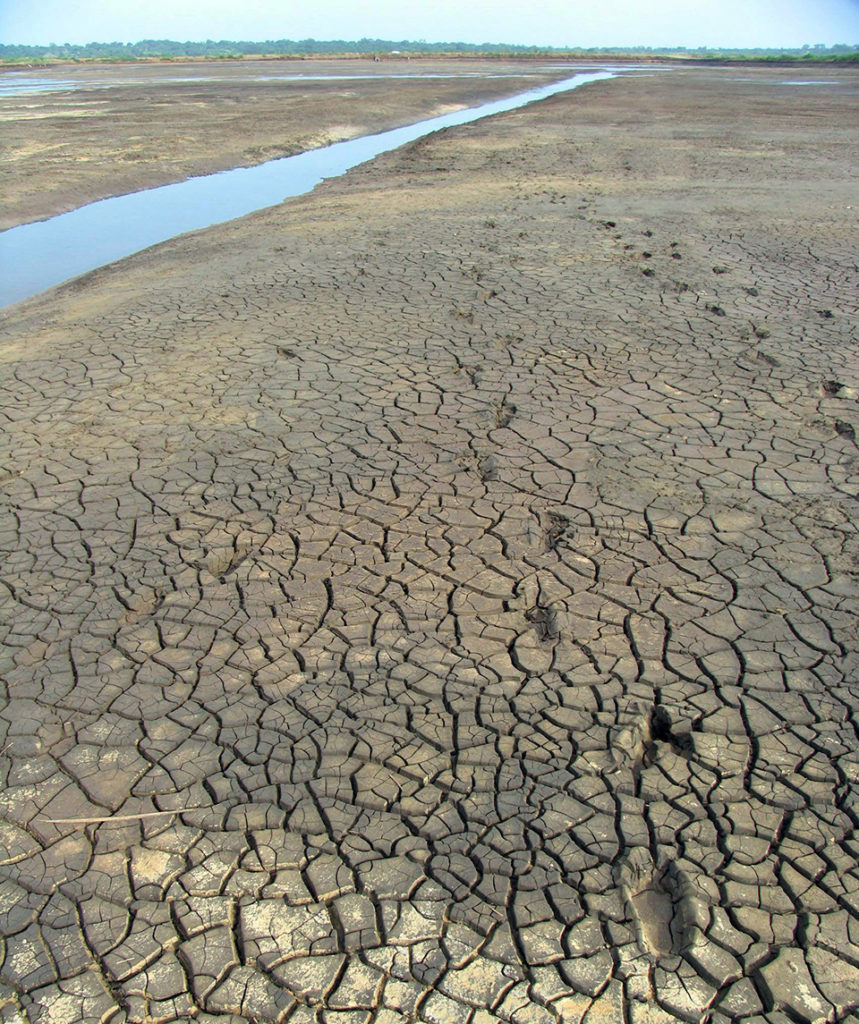
The traditional way of destroying organisms in pond bottoms is thorough dry-out for a week or longer. Fish toxicants and liming can kill unwanted parasites.
Responsibility
Light penetration in water
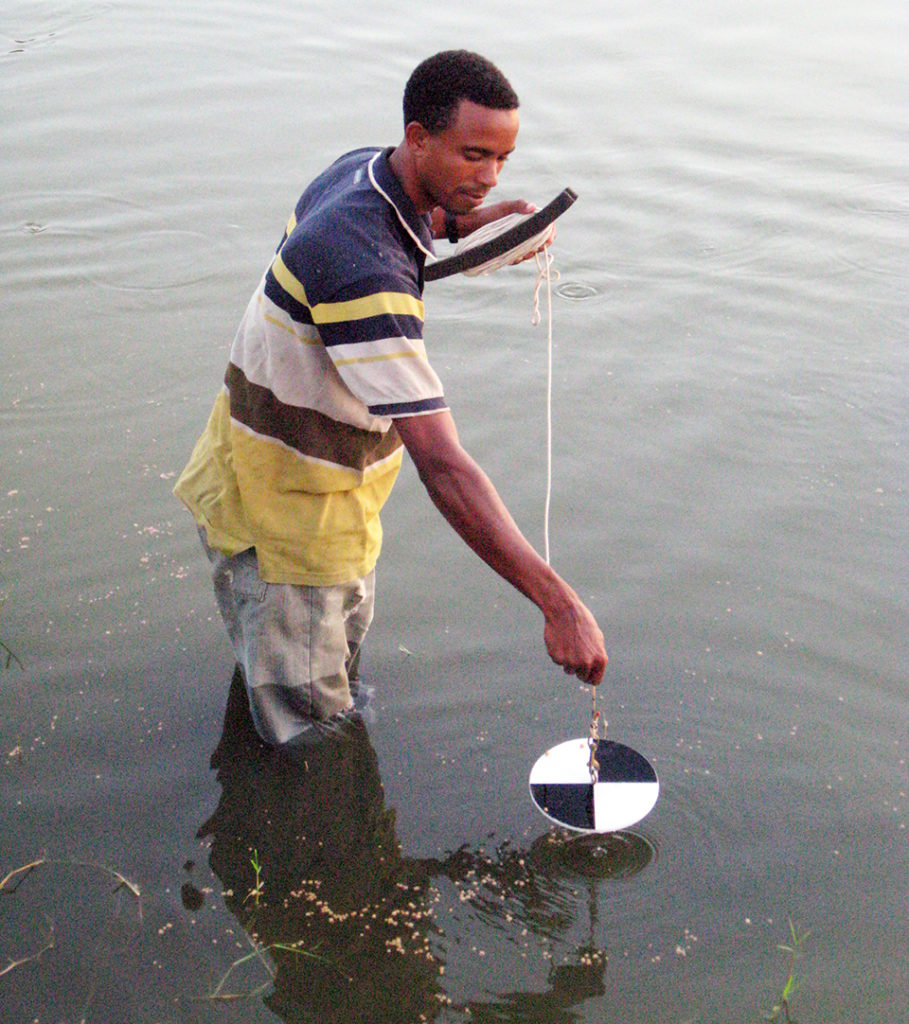
Light penetrating water is scattered and absorbed exponentially as it passes downward. The presence of dissolved organic matter and suspended solids further impedes light penetration, and different types of solids absorb different wavelengths.

