Results show modest low emission intensity of aquaculture relative to terrestrial livestock
The aquaculture industry provides an important contribution to global food security directly (by increasing food availability and accessibility) and indirectly (as a driver of economic development). Importantly, fish are rich in protein and contain essential micronutrients which cannot easily be substituted by other food commodities.
One of the current, key environmental (and social) concerns is climate change, more specifically the greenhouse gas (GHG) emissions that arise along food supply chains. To enable sustainable expansion of aquaculture, we need to understand aquaculture’s contribution to global GHG emissions and how they can be mitigated.
This article – adapted and summarized from the original publication [MacLeod, M.J., Hasan, M.R., Robb, D.H.F. et al. Quantifying greenhouse gas emissions from global aquaculture. Sci Rep 10, 11679 (2020)] – reports on a study where we quantified the GHG emissions arising from the culture of the main aquatic animals reared for human consumption, i.e., bivalves, shrimps/prawns and finfish (catfish, cyprinids, Indian major carps, salmonids and tilapias). The method quantifies the main GHG emissions arising “cradle to farm-gate” from the following activities: the production of aquafeed raw materials; processing and transport of feed materials; production of compound feed in feed mills and transport to the fish farm; aquaculture of organisms.
We also compared these estimates of global aquaculture emissions to other livestock sectors, and calculated the emissions intensity (i.e., the kg of GHG emissions per unit of edible output) of aquaculture and explain the factors that influence it. Recent commercial feed formulations were used for the main species groups and geographic regions, thereby providing a more up to date and detailed analysis than is generally provided in academic literature.
Study setup
Global aquaculture is a complex sector consisting of many different species reared in a variety of systems and environments. To manage this complexity in the study, our analysis focused on the main cultured aquatic animal species groups (aquatic plants are excluded), i.e., bivalves, catfish, cyprinids, freshwater fish (general), Indian major carps, marine fish (general), salmonids, shrimps and prawns and tilapias.
The main species groups were identified by extracting production data from the Food and Agriculture Organization of the United Nations (FAO), listing the species groups within each geographical region (according to FAO definitions) in order of production amount, then selecting the groups until they accounted for >90 percent of the production within the region (>85 percent in Eastern Europe). This approach captured an estimated 93 percent of global production. Carbon sequestration in pond sediments is not included in this study.
For detailed information on the data and GHG categories included in the calculations; emission factors used for feed raw materials and fertilizers; feed conversion ratios and ration composition; total production by species-group and regions; on-farm energy use and other data; and calculations used, refer to the original publication.
https://www.aquaculturealliance.org/advocate/life-cycle-assessment-in-aquaculture/
Results and discussion
We calculated the GHG emissions for the year 2017 for the nine major aquaculture culture groups (which accounted for 93 percent of global aquaculture production). The total GHG emissions for this 93 percent were 245 million tons of CO2e [carbon dioxide, CO2, equivalent or CO2e refers to CO2 emissions (metric tons) with the same global warming potential as one metric ton of another greenhouse gas – it is a standard unit for measuring carbon footprint].
Assuming that the remaining 7 percent of production had the same emissions intensity (EI), the total emissions in 2017 for all shellfish and finfish aquaculture would have been 263 million tons of CO2e (Table 1). The United Nations Environmental Programme, UNEP estimated total anthropogenic emissions to be 53.5 gigatons, Gt [1 billion tons], of CO2eq/year in 2017, so the culture of aquatic animals represented approximately 0.49 percent of the total anthropogenic [caused by human action or inaction] emissions.
MacLeod, GHG, Table 1
| GHG emissions (x1000 tons CO2e) | Bivalves | Catfish | Cyprinids | Freshwater fish, general | Indian major carps | Marine fish, general | Salmonids | Shrimps/prawns | Tilapias | Total |
|---|
GHG emissions (x1000 tons CO2e) | Bivalves | Catfish | Cyprinids | Freshwater fish, general | Indian major carps | Marine fish, general | Salmonids | Shrimps/prawns | Tilapias | Total |
|---|---|---|---|---|---|---|---|---|---|---|
| East Asia | 16,775 | 13,018 | 70,264 | 13,468 | 0 | 20,695 | 0 | 43,782 | 15,319 | 193,319 |
| South Asia | 0 | 2,788 | 3,763 | 3,144 | 12,743 | 0 | 0 | 5,270 | 0 | 27,708 |
| Sub-Saharan Africa | 0 | 530 | 74 | 160 | 0 | 0 | 0 | 0 | 812 | 1,576 |
| West Asia & North Africa | 0 | 0 | 592 | 0 | 0 | 2,203 | 263 | 0 | 3,288 | 6,346 |
| Central & South America | 389 | 0 | 0 | 522 | 0 | 0 | 4,215 | 2,418 | 1,017 | 8,561 |
| Oceania | 126 | 0 | 0 | 0 | 0 | 215 | 133 | 0 | 0 | 474 |
| Eastern Europe | 0 | 0 | 176 | 0 | 0 | 0 | 49 | 0 | 0 | 225 |
| Western Europe | 639 | 0 | 0 | 0 | 0 | 0 | 4,902 | 0 | 0 | 5,542 |
| North America | 228 | 356 | 0 | 0 | 0 | 0 | 420 | 295 | 0 | 1,299 |
| Russian Federation | 0 | 0 | 189 | 0 | 0 | 0 | 119 | 0 | 0 | 307 |
| WORLD | 18,157 | 16,692 | 75,057 | 17,743 | 12,743 | 23,112 | 10,102 | 51,764 | 20,436 | 245,357 |
The geographical pattern of emissions closely mirrors production, i.e., most of the emissions are from regions with the greatest aquaculture production: East Asia and South Asia. Emissions also correlate closely with production for most species groups, e.g., cyprinids [carps] account for 31 percent of emissions and 31 percent of production. However, there are exceptions to this: shrimp account for 21 percent of emissions but only 10 percent of production, while bivalves produce 7 percent of emissions but represent 21 percent of production.
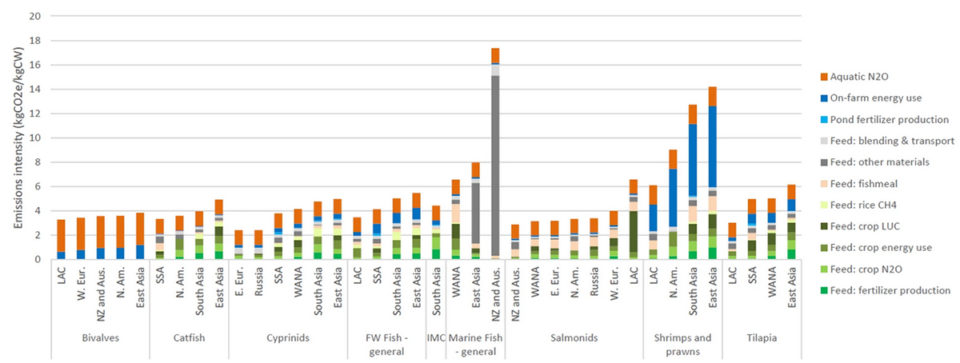
The regional average emission intensity (EI) of each species-group (Figure 1) shows that for most of the finfish, the EI lies between 4 and 6 kg CO2e/kg CW (carcass weight, i.e., per kg of edible flesh) at the farm gate. The exception is the category “marine fishes, general,” which has a significantly higher EI, due to the assumption that the ration in East Asia (and New Zealand and Australia) is 100 percent low value fish/trash fish (which has a higher EI than most crop feed materials) and the higher feed conversion ratio (FCR, i.e., the kg of feed input per unit of liveweight gain) of this species-group. Shrimps and prawns have high EI, due to the greater amounts of energy used in these systems (primarily for water aeration and pumping). In contrast, bivalves have the lowest EI as they have no feed emissions, relying on natural food from their environment.
For all finfish there are some differences in the sources of GHG emissions. Species predominantly reared in Asia (i.e., Indian major carps, freshwater catfishes and cyprinids) have higher rice methane (CH4) emissions, while the carnivorous salmonids have more emissions associated with fishmeal and higher crop land use change (LUC) emissions (arising from soybean production), reflecting their higher protein rations.
Comparing global averages, aquaculture has a much lower EI than ruminant meat and is similar to the main monogastric commodities (pig meat and broiler meat). There can be significant variation in the EI of commodities, depending on factors such as genetics, feeding and farm management. Both finfish and shellfish have lower EI than ruminants for three main reasons: they do not produce CH4 via enteric fermentation, they have much higher fertility (so the “breeding overhead” is therefore much lower) and they have lower feed conversion ratios (which are a key determinant of fish EI, given the predominance of feed related emissions). Fish generally have lower FCRs than terrestrial mammals, due to the latter’s higher maintenance and respiratory costs. Being buoyant and streamlined, fish require less energy for locomotion, they are cold-blooded and excrete ammonia directly.
Production of crop feed materials (Fig. 1, green segments) accounted for 39 percent of total aquaculture emissions. When the emissions arising from fishmeal production, feed blending and transport are added, feed production accounts for 57 percent of emissions. The bulk of the non-feed emissions arise from the nitrification and denitrification of nitrogenous compounds in the aquatic system (“aquatic N2O”) and energy use on the fish farm (primarily for pumping water, lighting and powering vehicles).
Our analysis has limitations because emissions are calculated for aquaculture of aquatic animals only, and therefore do not include the emissions arising from the production of aquatic plants, which constitute a significant proportion of global aquaculture production.
The importance of feed is clear in Fig. 1 for all fed species. However, feed composition is constantly changing as nutritional knowledge and its application develop in response to commercial demand. Our study was based on regional assumptions of feed formulations and raw material origins for the main species in the key regions. Data for this was obtained from a variety of sources (see original publication) and updated in light of discussions with feed companies. Improved knowledge of feed formulation and raw-material sourcing combined with the overall feed efficiencies of conversion to edible seafood will help provide a more accurate picture of the overall emissions. Ultimately, this would have to be done with primary data from feed companies and farmers on a case-by-case level.
The analyses do not include losses and emissions occurring post-farm. Depending on the specifics of the post-farm supply chain (e.g., mode of transport, distance transported, mode of processing, storage conditions), significant emissions can arise from energy use in transportation or from refrigerant leakage in cold chains. However, it should be noted that all GHG emissions are attributed to the aquaculture in this study, whereas, in practice, aquaculture produces processing byproducts (such as trimmings) that are often used in other sectors and the associated emissions should be allocated to those sectors.
The estimates of aquatic N2O should be treated with caution, as the rate at which N is converted to N2O in aquatic systems can vary greatly, depending on the environmental conditions. It has been noted that nitrification and denitrification processes are influenced by many parameters (e.g., dissolved oxygen concentration, pH, temperature).
Regarding the reduction of emissions from aquaculture, because the aquaculture sector is relatively young compared with terrestrial livestock sectors, it offers great scope for technical innovation to further increase resource efficiency. Researchers have identified four broad technological approaches to reducing the environmental impact of aquaculture: (1) breeding and genetics, (2) disease control, (3) nutrition and feeding and (4) low-impact production systems. Within each of these approaches are many individual measures that could be used to reduce (or mitigate) GHG emissions.
There are many ways of reducing emissions from crop production that could be employed to reduce aquaculture feed emissions. Other measures to reduce feed emissions target the efficiency of feeding. Aquaculture nutrition is arguably more complicated than terrestrial livestock production, because many more aquatic species are being farmed, each with potentially different nutritional requirements. The opportunity to optimize nutrition is probably greater in aquaculture than in terrestrial species because much greater research effort has been focused on terrestrial species to date.
Some mitigation measures may be quite expensive while others are relatively cheap or may even reduce costs. To achieve the goals of reducing emissions while increasing the supply of affordable protein, we need to analyze the effects that introducing measures may have on farm profits and emissions. Cost-effectiveness analysis, CEA [a form of economic analysis that compares the relative costs and outcomes of different courses of action; different from cost-benefit analysis, which assigns a monetary value to the measure of effect] can help us to understand these effects.
Our study relied on data currently available in the literature. While the best available data have been used, we recommend that true empirical studies, involving primary data gathering on key parameters, should be undertaken to validate the results.
Perspectives
Aquaculture is a biologically efficient way of producing animal protein compared to terrestrial livestock (particularly ruminants) due largely to the high fertility and low feed conversion ratios of fish. The biological efficiency is reflected in the relatively low prices and emissions intensities of many aquaculture commodities.
However, the moderate GHG emissions from aquaculture should not be grounds for complacency. Aquaculture production is increasing rapidly and emissions arising post-farm, which are not included in this study, could increase the emissions intensity of some supply chains significantly.
Furthermore, aquaculture can have important non-GHG impacts on, for example, water quality and marine biodiversity. It is therefore important to continue to improve the efficiency of global aquaculture to offset increases in production so that it can continue to make an important contribution to food security.
Fortunately, the relatively immature nature of the sector (compared to agriculture) means that there is great scope to improve resource efficiency through technical innovation, often in ways that reduce emissions while improving profitability. CEA can be used to help identify the most cost-effective efficiency improvements, thereby supporting the sustainable development of aquaculture.
Now that you've reached the end of the article ...
… please consider supporting GSA’s mission to advance responsible seafood practices through education, advocacy and third-party assurances. The Advocate aims to document the evolution of responsible seafood practices and share the expansive knowledge of our vast network of contributors.
By becoming a Global Seafood Alliance member, you’re ensuring that all of the pre-competitive work we do through member benefits, resources and events can continue. Individual membership costs just $50 a year.
Not a GSA member? Join us.
Authors
-
Michael J. MacLeod, Ph.D.
Corresponding author
Scotland’s Rural College, Edinburgh, UK -
Mohammad R. Hasan, Ph.D.
Aquaculture Branch
FAO Fisheries and Aquaculture Department
Rome, Italy -
David H.F. Robb
Cargill Animal Nutrition and Health
Aquaculture Business
Surrey, UK -
Mohammad Mamun-Ur-Rashid
WorldFish
Dhaka, Bangladesh
Tagged With
Related Posts
Responsibility
Aquaculture Exchange: Peter Bridson
Peter Bridson, who steered aquaculture research for Seafood Watch and its highly influential marketplace recommendations for six years, now runs his own consultancy, Seagreen Research. He discusses global food security, certification standards and gradually changing perceptions about farmed salmon.
Responsibility
Aquaculture ponds hold carbon
Although 16.6 million metric tons of carbon are annually buried in aquaculture ponds, estimated carbon emissions for culture species have approached several metric tons of carbon per metric ton of aquaculture product.
Responsibility
Calories count. Aquaculture makes them truly add up.
Salmon farms are quite different from terrestrial farms in providing both nutrition and calories. They produce stunningly more of both than their land-based counterparts.
Responsibility
A wider view: It’s blue food’s time
There is urgency to conversations about the role of blue food in mitigating climate change, increasing momentum toward some specific goals.


