Testing monitored ammonia inflow concentration and loading rate, nitrite, nitrate, hydraulic loading, head loss and biofilm thickness
Many biofilter configurations are used to improve water quality, and their performance varies dramatically with loading and management.
For fluidized-bed filters, good biofilm management addresses the needs of nitrifying bacteria in terms of water quality, nutrient transport, and biofilm sloughing. Ammonia and nitrite conversion rates are used to evaluate of biofilter performance. Also, models of the biofilm are useful for biofilter design, because they can predict the expected thickness of a biofilm from the substrate concentration.
Filter performance tested
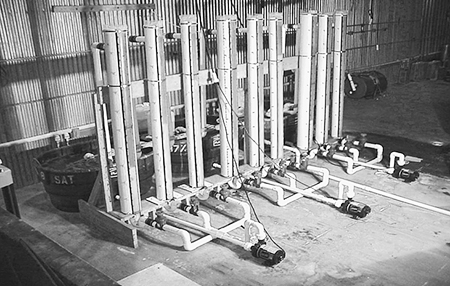
A study by the author evaluated the nitrification performance of three fluidized-bed filters. Each filter contained 10 liters of ABS (acrylonitrile, butadiene, and styrene) plastic bead media, with cylindrical shape of 2- to 4-mm diameter and length. Three bed height-to-diameter ratios were used with column diameters of 12.7, 15.2, and 17.8 cm. The biofilters were connected in parallel to a reservoir containing 500 liters of water.
The systems were allowed to acclimate using a solution of ammonia and other nutrients. To evaluate filter performance, testing monitored ammonia inflow concentration, ammonia loading rate, nitrite, nitrate, hydraulic loading, head loss and biofilm thickness.
Water flow
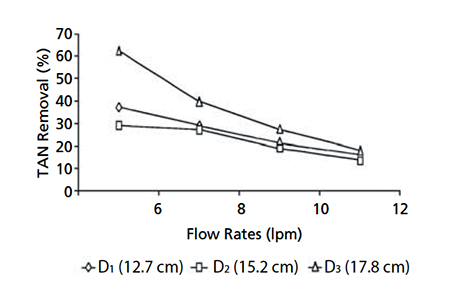
Four flow rates ranging 6 to 12 liter per minute were tested for each biofilter type, at a constant ammonia feed level of 180 milligrams per square meter per day. The 17.8-cm-diameter biofilter (D3) showed the highest ammonia removal rate at a flow rate of 6 liter per minute, followed by the 12.7-cm (D1) and 15.2-cm (D2) filters.
Increased flow rate decreased the difference in ammonia and nitrite removal rates among the biofilters. The increased flow rate also reduced the ammonia level in the system from 0.6 to 0.5 milligrams per liter, but did not affect nitrite concentrations.
Ammonia feed rates
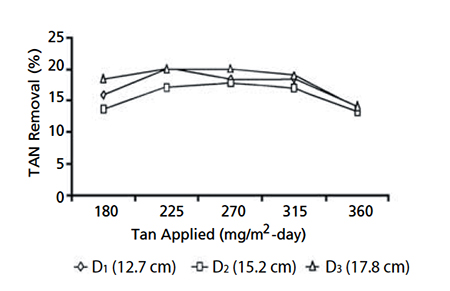
The effects of five ammonia feed rates of 180 to 360 milligrams per square meter per day were tested at a flow rate of 12 liter per minute. Maximum ammonia removal was observed at ammonia loadings of 270 milligrams per square meter per day. Ammonia and nitrite removal rates differed between biofilters, but the differences were smaller than those regarding flow variation.
Ammonia accumulated in the tanks at 0.5 to 1.0 milligrams per liter as ammonia loading increased, although nitrite concentration remained relatively constant. This indicated that in plastic bead systems, there is a limitation in nitrification rate with increasing ammonia concentration that results in ammonia accumulation. However, the results showed that nitrification performance improved by 17 percent as the flow rates were increased.
Biofilm development
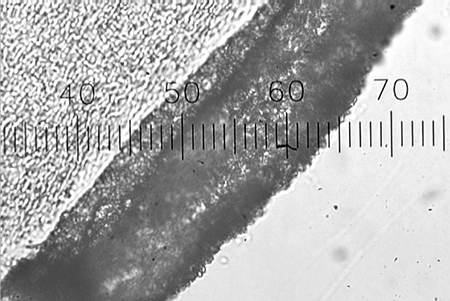
Biofilm thickness increased with ammonia loading, but decreased with increased hydraulic loading rate. Fig. 3 shows an electron micrograph of the cross-section of a bead covered with biofilm. Biofilm thicknesses observed in this study were less than those predicted using a biofilm model.
Fluidization
Fluidizing a column means pumping against head loss at the bottom plate, in the beads, and in the water column. Head loss varied with flow rate and degree of media fluidization, ranging from 4.6 cm in biofilter D1 at 6 liters per minute to 1.8 cm in biofilter D3 at 12 liters per minute. The percentage of bed expansion increased linearly with water velocity for each biofilter.
There was only a small density difference between the media, biofilm, and water. Hence, there were no significant changes in fluidization level as biofilm accumulated or was sheared off, suggesting the fluidization of plastic beads is more constant over a range of biofilm thicknesses than in sand biofilters.
(Editor’s Note: This article was originally published in the June 2002 print edition of the Global Aquaculture Advocate.)
Now that you've reached the end of the article ...
… please consider supporting GSA’s mission to advance responsible seafood practices through education, advocacy and third-party assurances. The Advocate aims to document the evolution of responsible seafood practices and share the expansive knowledge of our vast network of contributors.
By becoming a Global Seafood Alliance member, you’re ensuring that all of the pre-competitive work we do through member benefits, resources and events can continue. Individual membership costs just $50 a year.
Not a GSA member? Join us.
Author
-
Simonel I. Sandu
Fisheries and Wildlife Department
Virginia Polytechnic Institute and State University
Blacksburg, Virginia 24061 USA
Tagged With
Related Posts
Health & Welfare
International coalition breaks cobia fingerling production bottleneck
Fingerling production has long been a bottleneck in the advancement of cobia culture. A coalition has validated intensive larviculture production systems and protocols that deliver 35 percent survival.
Responsibility
A look at various intensive shrimp farming systems in Asia
The impact of diseases led some Asian shrimp farming countries to develop biofloc and recirculation aquaculture system (RAS) production technologies. Treating incoming water for culture operations and wastewater treatment are biosecurity measures for disease prevention and control.
Innovation & Investment
A review of unit processes in RAS systems
Since un-ionized ammonia-nitrogen and nitrite-nitrogen are toxic to most finfish, controlling their concentrations in culture tanks is a primary objective in the design of recirculating aquaculture systems.
Health & Welfare
Ammonia addition enhances microbial flocs in nursery phase for Pacific white shrimp
In a study, “pre-fertilization” in the nursery phase of a biofloc system for shrimp was tested. The objective was to accelerate the biofloc formation to minimize ammonia concentrations, avoiding high peaks during culture.


