Professor Boyd: Principles and measurement of an important production parameter
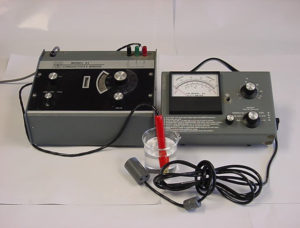
The electrical conductivity of water, usually called specific conductance or simply conductivity, can be quickly measured with laboratory bench or portable meters (Fig. 1) to provide an assessment of the total concentration of dissolved ions. The conductivity of aquaculture waters is frequently measured, and I would like to provide a relatively simple discussion of the basic principles and measurement of this property of water.
Conductivity in water: Ohm’s law
Ohm’s law is the basis for the conductivity measurement in water. This law defines the resistance to flow of electricity between two points in a circuit; an electromotive force (E) of 1 volt will cause a current (I) of 1 ampere to flow against a resistance (R) of 1 ohm. The Ohm’s law equation is E = I ´ R or V (volts) = I ´ R. The amount of resistance imposed by the wire in a simple circuit is directly proportional to the length (L) of the wire and inversely proportional to wire diameter (A) or R = L/A. Different substances, e.g., wires made of different metals, have different and characteristic abilities to resist the flow of electricity. The characteristic resistance of a substance is called its specific resistance (r); hence, R = r(L/A). Because r is in ohms, R is in ohms/cm. Substances other than wire also cause resistance, and water itself is the resistor with respect to flow of electricity in water.
A resistor also is a conductor of electricity, and conductance (K) is the reciprocal of resistance or K = 1/R. A conductor also has a specific conductance (k), and k = 1/r or k = (1/r)(L/A). The unit of measure for conductance is reciprocal of ohms or 1/ohms, but to make a more convenient unit it has been traditional to refer to 1/mhos as mhos – ohms spelled backwards.
Water conducts electricity via the ions dissolved in it, and pure water is a poor conductor of electricity. Most natural waters, however, contain dissolved ions, and as a result, their conductivity increases with greater total ion concentration.
Measuring conductivity
A conductivity meter for use in water is a modification of the traditional Wheatstone bridge used to determine the resistance of a resistor of unknown resistance. In a conductivity meter for water, the unknown resistance is that of water into which the probe of the meter is inserted. The Wheatstone bridge component of the meter determines the resistance across a 1-cm3 cube of water.
Unlike a Wheatstone bridge which displays resistance, a conductivity meter displays the conductivity of water in mhos/centimeter (mhos/cm). This value is a very small number in weakly mineralized water, and to avoid cumbersome decimal points, conductivity meters usually also display in micromhos/centimeter (mmhos/cm). Today, many conductivity meters display in the international scientific (SI) unit of conductance the siemens. The readout in SI units of microsiemens per centimeter (mS/cm) is for all practical purposes equivalent to the traditional micromhos per centimeter.
Potassium chloride (KCl) is the standard used in conductivity measurement. The specific conductances of different aqueous concentrations of potassium chloride at 25 degrees-C are provided in Table 1. Specific conductance, however, varies with temperature. For example, at 25 degrees-C a 0.01 N potassium chloride solution has a specific conductance of 1,413 mmhos/cm (Table 1), but at 20 degrees-C and 30 degrees-C, the values are 1,273 and 1,547 mmhos/cm, respectively. Most conductivity meters have a temperature compensator, and they automatically display the conductivity for 25 degrees-C.
Boyd, conductivity, part 1, Table 1
| Normality of KCl | mg/L of KCl | Specific conductance (u-mhos/cm) |
|---|---|---|
| 0.0001 | 7.5 | 14.94 |
| 0.005 | 37.3 | 73.90 |
| 0.001 | 75 | 147.0 |
| 0.005 | 373 | 717.8 |
| 0.01 | 746 | 1,413 |
| 0.05 | 3,728 | 6,668 |
| 0.1 | 7,455 | 12,900 |
| 0.5 | 37,275 | 58,640 |
There is a definite relationship between increasing potassium chloride concentration and greater conductivity (Table 1). There also is a similar relationship between ionic concentration and specific conductance among natural waters from different sources, but it usually is not as strong as the one exhibited by potassium chloride concentrations in Table 1.
The increase in conductivity caused by 1 mg/L of different species of dissolved ions differs among ion species as illustrated in Table 2 for the seven, major ions that are responsible for most of the conductivity in natural waters. For example, 1 mg/L of magnesium (Mg2+) results in more than five times greater conductivity than does 1 mg/L bicarbonate (HCO3–). Values in Table 2 can be used to calculate the conductivity of a solution from its ionic concentrations, but the equivalent conductance values apply strictly only to ion concentrations at infinitive dilution (very low concentration).
Measured conductivity will be less than conductivity calculated with equivalent conductance values in Table 2, because of formation of ion pairs and other ion complexes in the water. These ion associations do not conduct appreciable electricity, and they reduce conductivity without affecting measured ion concentrations. The discrepancy between measured and calculated conductivity increases with increasing total ion concentration, because the degree of ion complexing is greater in more concentrated solutions.
Boyd, conductivity, part 1, Table 2
| Cations | u-mhos/cm per mg/L | Anions | u-mhos/cm per mg/L |
|---|---|---|---|
| Potassium | 1.88 | Sulfate | 1.66 |
| Calcium | 2.97 | Choride | 1.95 |
| Magnesium | 4.37 | Bicarbonate | 0.73 |
| Sodium | 2.18 |
Conductivities of different ion species also differ (Table 2). In the ocean and in lower reaches of estuaries, ionic proportions tend to be similar worldwide, and a rather constant relationship between total ion concentration and conductivity persists. On the contrary, in freshwater, ionic proportions vary greatly among different waters. As a result, two waters with the same total ion concentration seldom would have the same conductivity. Nevertheless, specific conductance usually is a fairly reliable method for estimating the relative degree of mineralization (total ion concentration) of freshwaters.
The factor that must be multiplied by specific conductance to obtain total ion concentration varies from about 0.55 to 0.8 across freshwaters. This factor usually is around 0.65 to 0.7 for ocean waters and water from the lower reaches of estuaries. Despite variation in the conductivity to total ion concentration ratio in different waters, specific conductance is a fairly good indicator of the degree of mineralization of different ocean waters, estuarine waters, and freshwaters.
Conductivity of different waters
The usual conductivity of some different types of waters follow: distilled water, <2 mmhos/cm; rainwater, <50 mmhos/cm; inland waters in humid regions, <500 mmhos/cm; inland waters in arid regions, 500 to >5,000 mmhos/cm; seawater, »50,000 mmhos/cm; estuaries, 1,500 to >50,000 mmhos/cm. The best quality drinking waters have conductivity of 50-500 mmhos/cm, but some may have values as high values of 1,000-1,500 mmhos/cm. Freshwaters will not have specific conductance values above around 1,500 mmhos/cm. All inland waters obviously are not freshwaters.
Now that you've reached the end of the article ...
… please consider supporting GSA’s mission to advance responsible seafood practices through education, advocacy and third-party assurances. The Advocate aims to document the evolution of responsible seafood practices and share the expansive knowledge of our vast network of contributors.
By becoming a Global Seafood Alliance member, you’re ensuring that all of the pre-competitive work we do through member benefits, resources and events can continue. Individual membership costs just $50 a year.
Not a GSA member? Join us.
Author
-

Claude E. Boyd, Ph.D.
School of Fisheries, Aquaculture and Aquatic Sciences
Auburn University
Auburn, Alabama 36849 USA
Tagged With
Related Posts
Health & Welfare
Decomposition and accumulation of organic matter in ponds
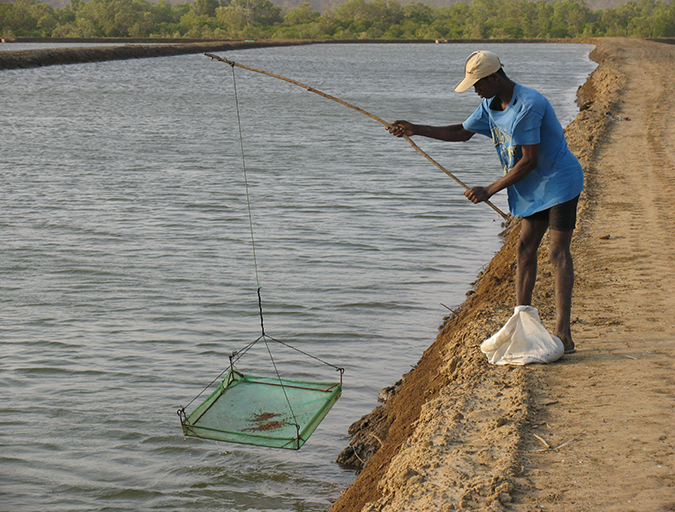
Aquaculture ponds accumulate organic matter from organic fertilizer, remains of microorganisms produced within the pond, feces of the culture animals and uneaten feed. Claude E. Boyd, Ph.D., details the leading organic matter management practices, and says that the accumulation of organic matter is often not as great as believed.
Health & Welfare
Phytoplankton and its impact on water quality
Phytoplankton has several important effects on water quality, including removing ammonia nitrogen from water and absorbing nutrients from the water for its growth. Abundance of blue-green algae tends to increase as nutrient inputs in aquafeeds or fertilizers increase.
Responsibility
Efficiency of mechanical aeration
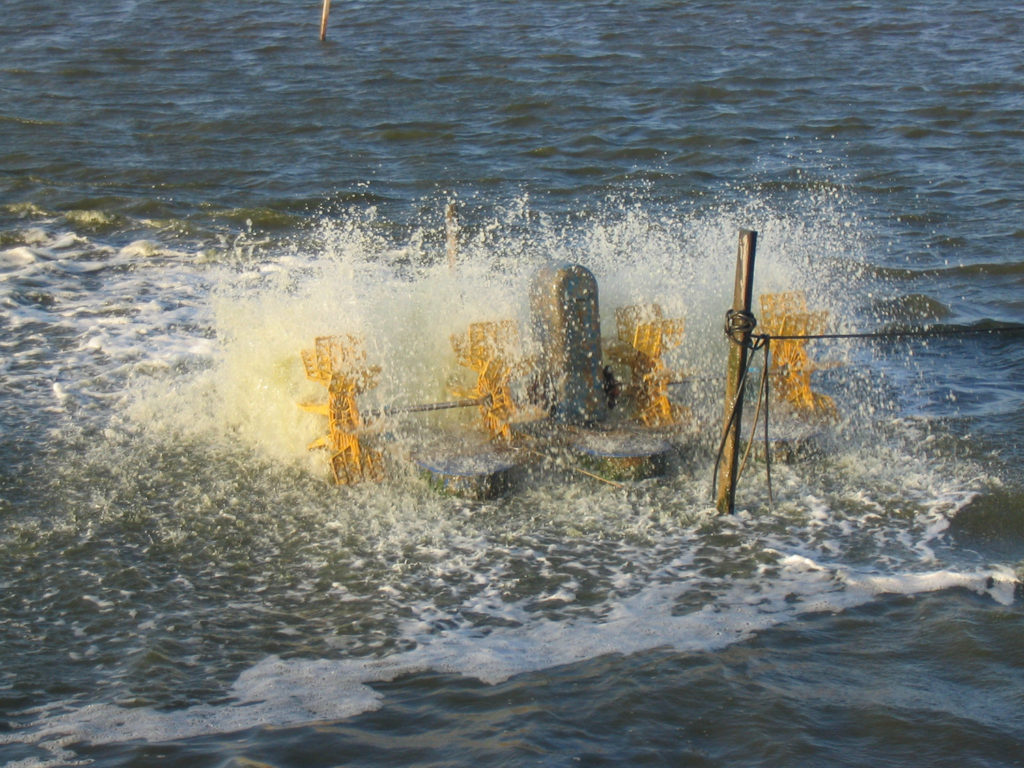
Although relatively expensive, mechanical aeration increases production. Asian-style paddlewheel aerators are widely used but are inefficient. Testing has led to more efficient designs that are now widely used in U.S. catfish and shrimp ponds.
Health & Welfare
How decomposition of organic matter impacts aquaculture ponds
Organic matter decomposition causes most of the water quality issues in aquaculture ponds. Bacterial populations are the primary organisms of decay in an aquaculture system, including its organic matter.


