Cost of photovoltaic energy systems was lower, generating a surplus and the highest cost savings
Fuel and electricity are the main power sources used to produce aquatic organisms; they are used for pumping water, cooling, processing, and aeration. Power costs depend on the regional location of the system. Electrical power consumption is directly proportional to the intensification of production and the technology used, and it contributes to the environmental impact of aquaculture. Electrical power use can put the viability of production systems at financial risk because of the increase and instability of power prices.
Electricity costs can account for 10–25 percent production costs in systems with electricity-intensive load, especially in recirculating aquaculture systems (RAS). Oxygenation equipment in RAS can consume 20 percent of the total power used and adds 5 percent to the final product cost per kilogram. Studies in Brazil have reported that the cost of electrical power in BFT systems in Brazil could account for 11 to 15 percent of the production costs for Nile tilapia (Oreochromis niloticus) production in a biofloc technology (BFT) system. Experimental projects with pacu (Piaractus brachypomus) and Nile tilapia using BFT in Colombia have reported that electrical power represents 10–14 percent of the production costs.
In aquaculture, different energy sources have been proposed for use according to the availability of resources in each country and the technologies developed. Examples include the use of geothermal power in systems for fish production in countries such as Iceland and Egypt, or the residual heat from thermoelectric or hydroelectric energy. There are limited studies on the use of biomass, wind, or tidal power in fish farming, and photovoltaic power has been proposed as an alternative in aquaculture and has been studied is studied in tilapia hatcheries, recirculation systems, and marine fish production.
This article – summarized from the original publication [Cala-Delgado, D.L. et al. 2024. Economic Analysis of Red Tilapia (Oreochromis sp.) Production Under Different Solar Energy Alternatives in a Commercial Biofloc System in Colombia. Fishes 2024, 9(12), 505] – reports on research that analyzed red tilapia (Oreochromis sp.) production in a BFT system using conventional electrical (hydroelectric) energy to determine whether photovoltaic energy, with its variations, can improve the economic viability of the activity.
Study setup
The study – carried out at the El Vergel Fish Farming Association in Arauca, Colombia – investigated the economic aspects of red tilapia (Oreochromis sp.) production using biofloc technology (BFT) under different electrical energy sources. The production system used included nine, 143 cubic meters, circular tanks, each with an independent energy supply and aeration system (Fig. 1).
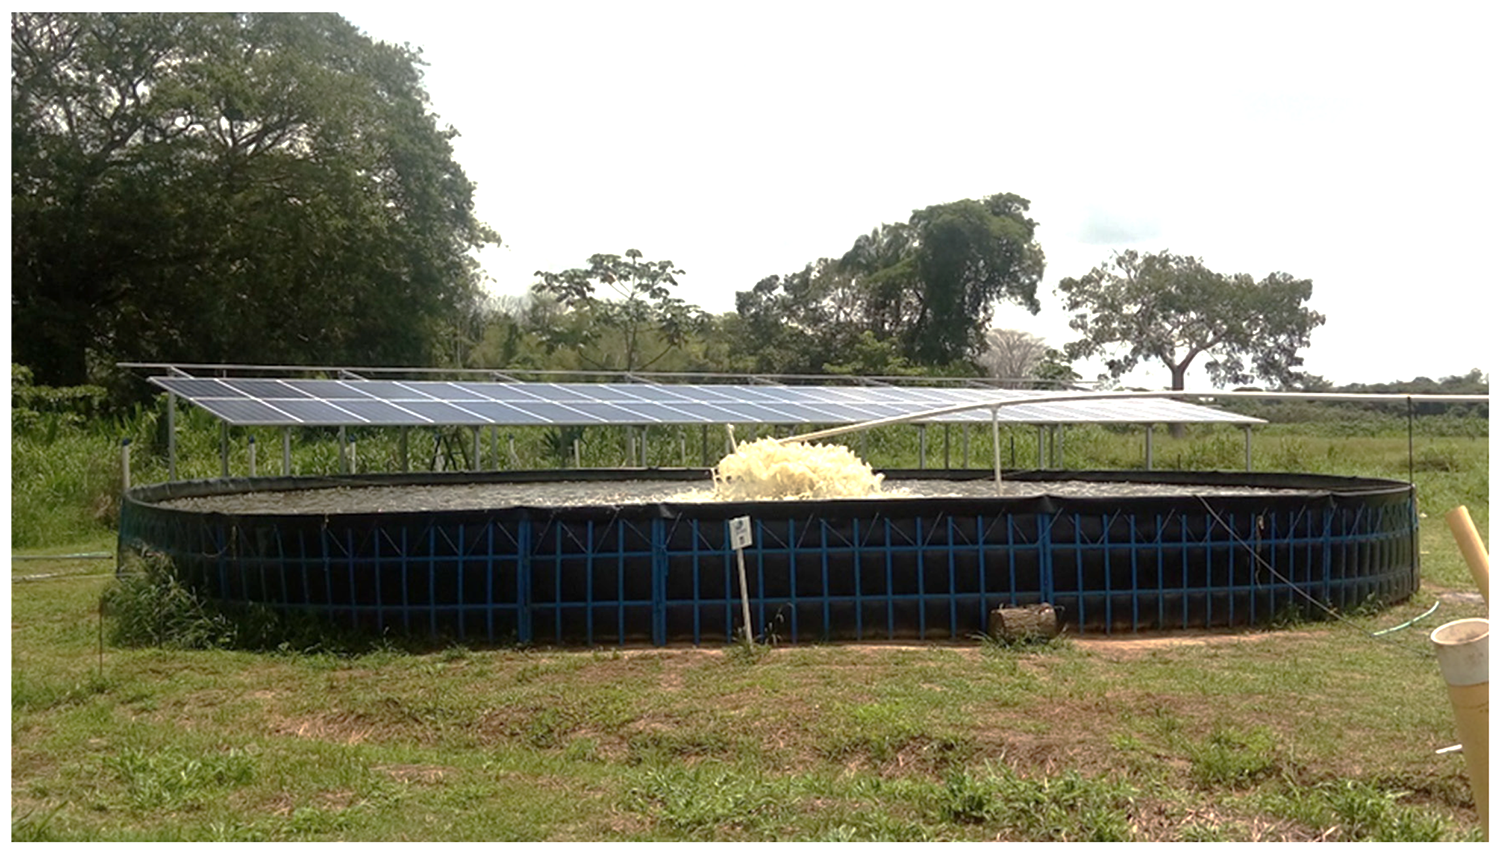
An average density of 6500 fish per tank (45.4 fish per cubic meter) was used, with red tilapia originally weighing 5 ± 0.2 grams each and previously masculinized using standard procedures. Aeration was constant during the study, provided by 1.5-hp radial splash aerators connected to the electrical power sources under study. For pH maintenance, 25 g/m3/day calcium hydroxide was added when values fell below 6.5. For the maintenance and control of nitrogen compound levels, liquid molasses (50 percent carbon) was used at a C:N ratio of 6:1 when ammonium values exceeded 1 mg per liter.
The study evaluated four energy treatments: conventional energy (CE), combined conventional and photovoltaic energy (CPVE), full photovoltaic energy (PVE), and simulation of photovoltaic energy generating surplus for nighttime use (PVES). CPVE utilizes photovoltaic energy during the day and conventional electricity at night, reducing costs by 40 percent but still relying on the grid at night. PVE is fully independent, relying on solar panels and batteries, eliminating electricity costs but requiring high upfront investment and ongoing maintenance due to battery depreciation. PVES generates enough photovoltaic energy for both day and night, selling the surplus during the day to cover nighttime usage, avoiding the need for batteries but still depending on the grid during outages.
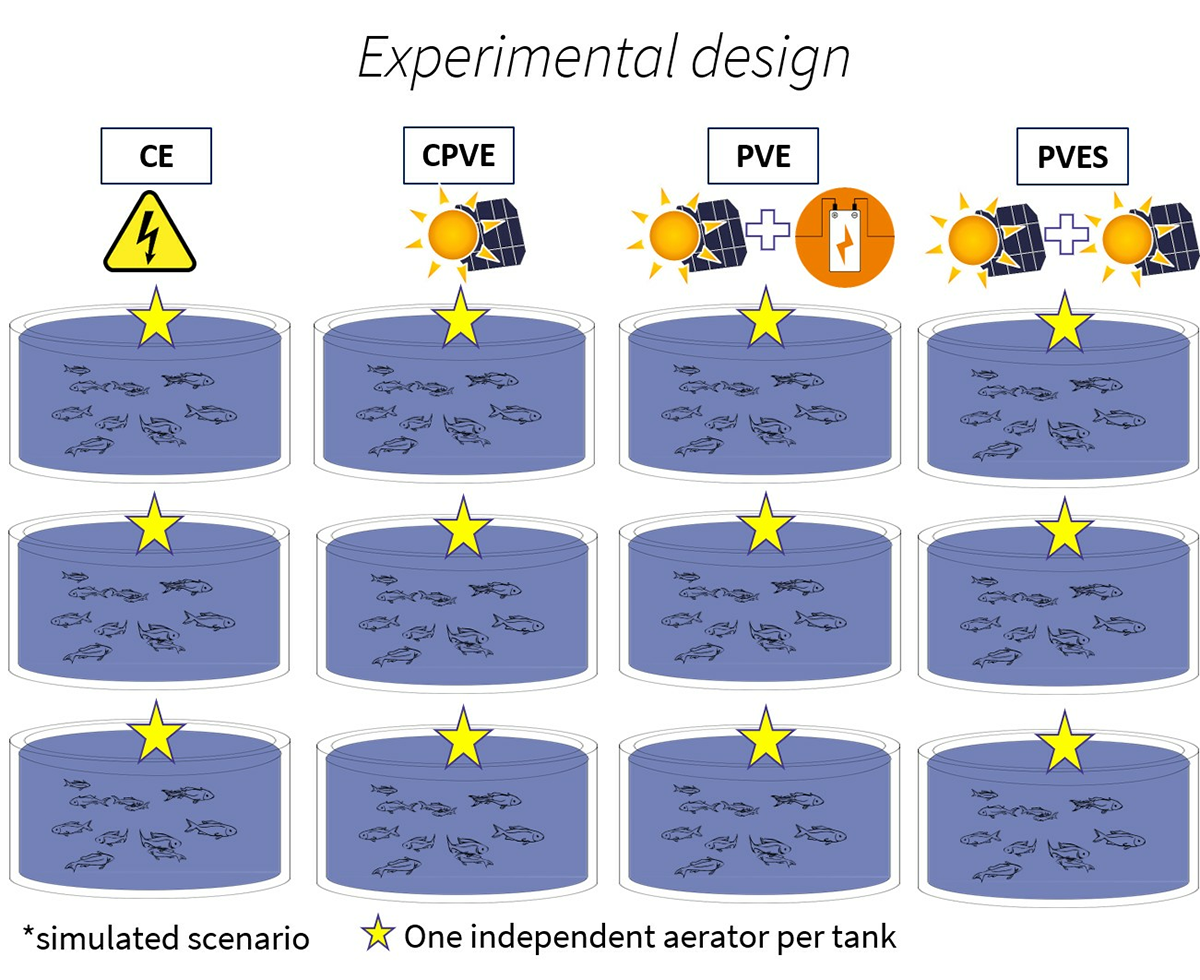
For detailed information on the experimental design, BFT system and energy systems used; data collection and analyses, refer to the original publication.
Results and discussion
The performance results of this study on red tilapia production using BFT in Colombia showed favorable survival rates and feed conversion ratios, with final biomass reaching 370–470 g over 30 weeks, but profitability depended on reducing energy costs and optimizing sales prices. Similarly, a BFT study on Nile tilapia in Brazil found that intermediate stocking densities (33 fish/m3) provided the best growth and profitability, with fish reaching an average weight of 842.26 grams. In Mexico, a comparison of BFT and green water technologies (GWT) showed that while BFT had reduced feed costs due to biofloc, it required more energy, especially during the dry season, and GWT was more cost-effective under certain conditions, achieving a feed conversion ratio of 1.27 and market size in 145 days.
The investment costs (Fig. 3) for the CE, CPVE, and PVE systems were U.S. $45,831.39, $58,035.91, and $147,219.67, respectively. For the simulation PVES system, the investment could reach up to $100,690.39. Commonly used infrastructure was the item with the highest percentage share of investment costs for CE and CPVE, 52.29 and 41.29 percent, respectively. The highest investment for PVE and PVES was the purchase of photovoltaic electric power systems, $103,507.90 and $56,978.62, respectively. The investment cost for purchase of splash aerators was between 12.17 percent and 3.79 percent for the different systems.
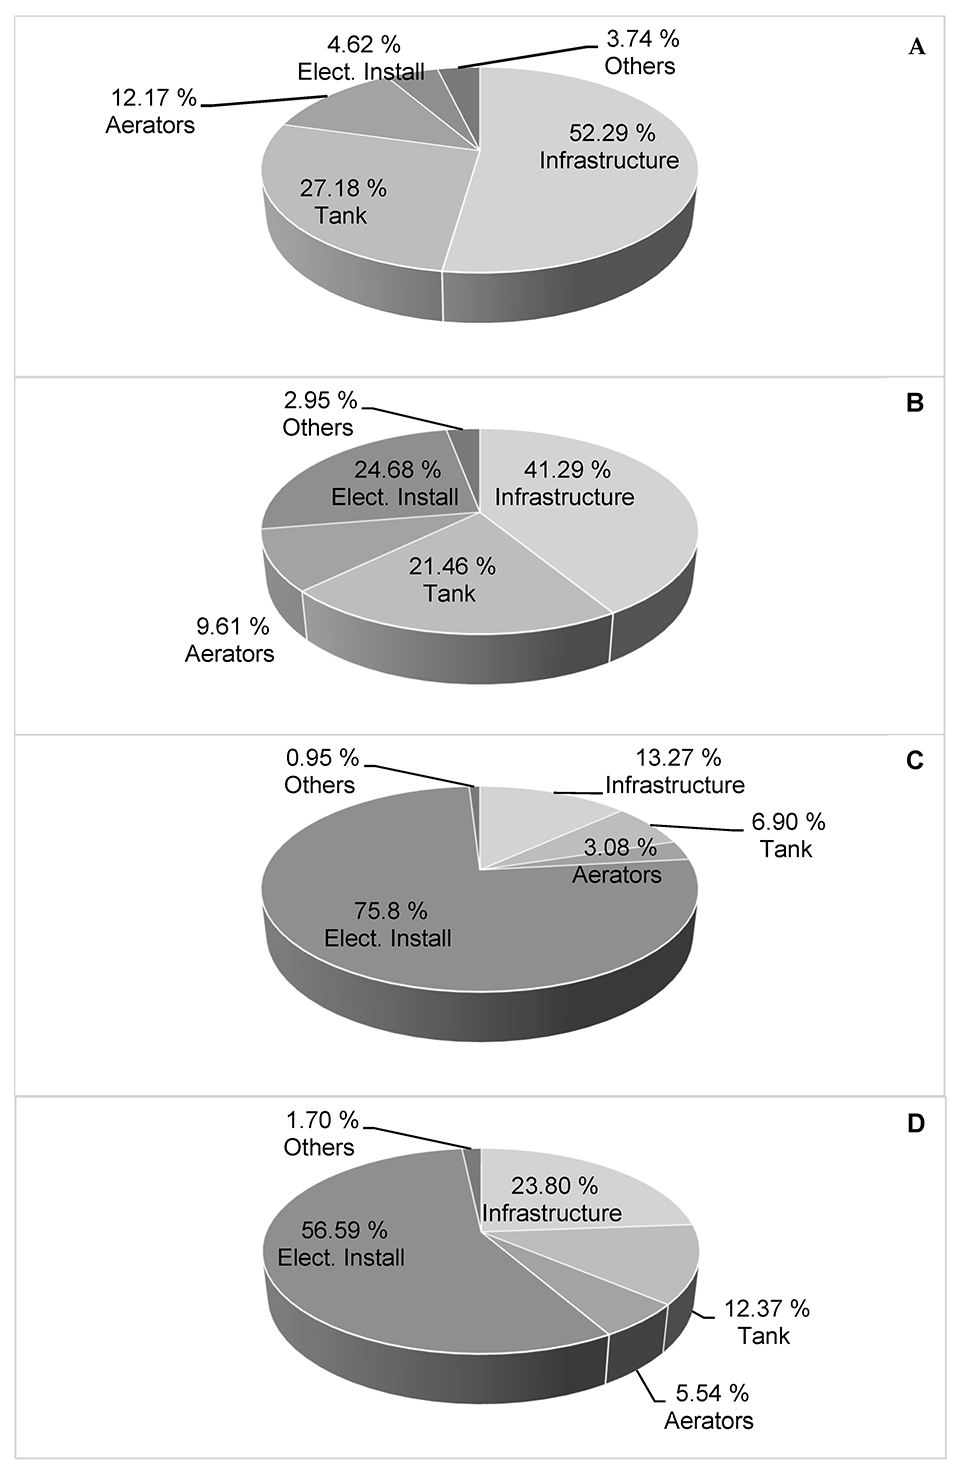
The investment value varied depending on the energy system used. Photovoltaic energy storage batteries increased the total investment cost threefold compared to that of production with conventional energy or a partial photovoltaic system. The investment in electrical installations for the PVE system doubled that of the PVES system, although the number of panels purchased for PVES was greater than that for PVE. The batteries cost thrice as much as the panels. Overall, the photovoltaic systems reduced production costs. The use of energy storage batteries in the PVE system decreased the total effective operating cost (EOC) by approximately 7.7 percent compared to that of the PVES system and by 27.4 percent compared to that of the CE system (Fig. 3).
The cost of feed was 41 percent for the CPVE and 39 percent for the CE and PVE systems (Figure 4). The highest cost of food in the entire study was observed for the PVES simulation with a 43 percent share in the production costs. The values were not affected by the energy system implemented for the operation of the aerators.
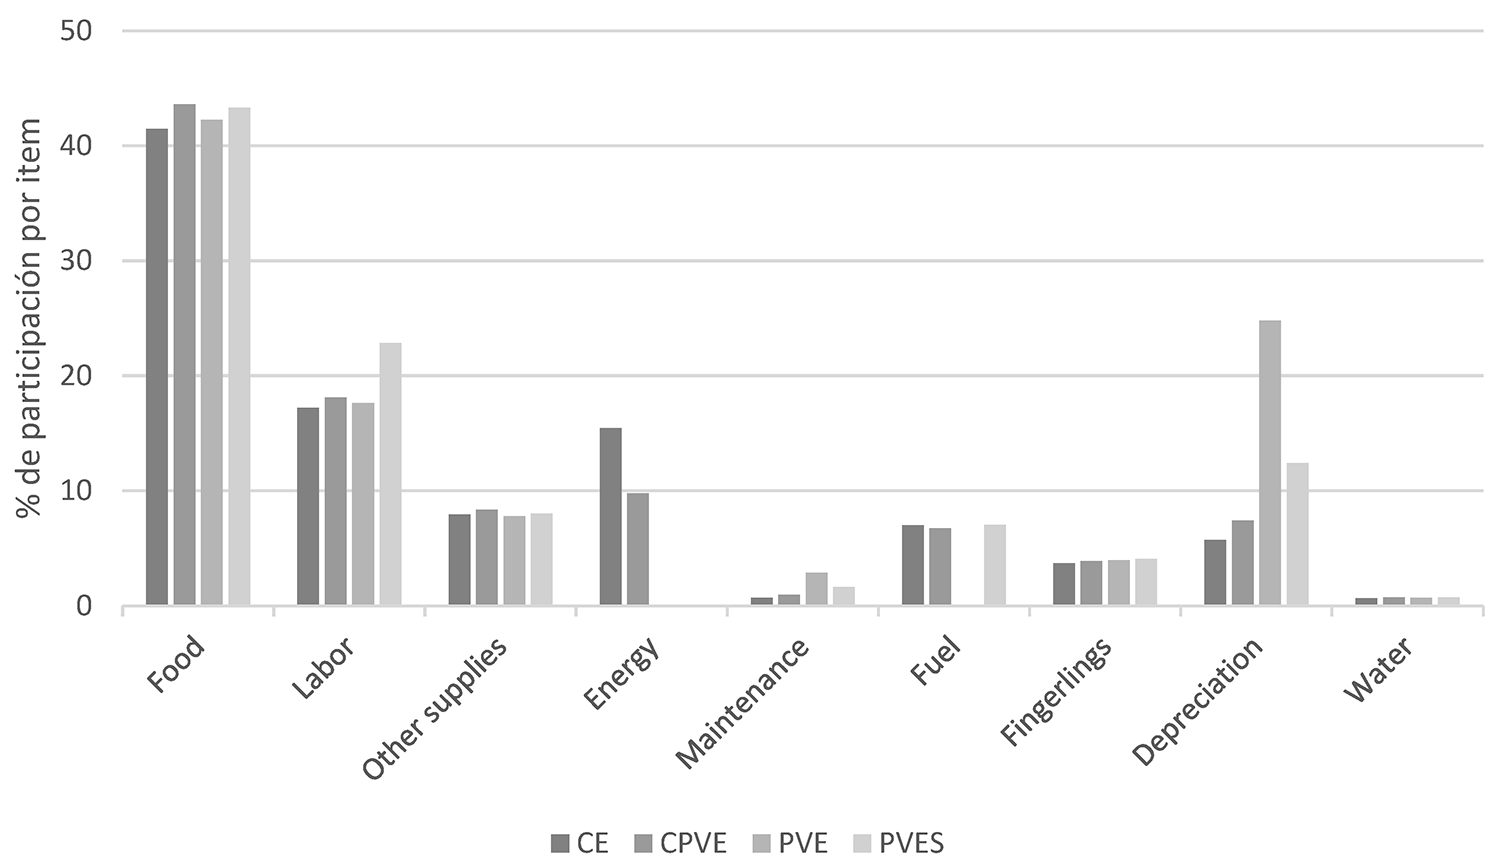
The specialized labor to implement the BFT system was the second item with the highest share in the production costs, with 20 percent, on average, for all the electrical energy systems studied.
The cost of water supply was the same for all systems. Electricity billing costs decreased with the implementation of photovoltaic systems. In PVE, the costs of power or fuel were not considered because of the storage batteries. Conversely, those systems without batteries consumed between 6 percent and 8 percent of fuel costs due to the use of electric generators during a power outage. This represented 9 percent and 14 percent in the CE and CPVE systems, respectively. The maintenance costs were $587.36 for PVES and $858.78 for PVE. This can be attributed to the equipment installed, whose cost was higher than that of conventional electrical installations. The battery life (five years) and equipment necessary for PVE represented 26 percent of the TOC in depreciation, making this system the one with the highest depreciation.
Gross profit is important while analyzing cash flow, which in turn is an indicator of the financial viability of production projects. In this study, the net present value (NPV), internal rate of return (IRR), and the payback period (PB) show that photovoltaic energy systems, although requiring higher initial capital due to solar panel and battery costs, can lead to substantial long-term savings in operating costs, especially energy costs. The highest NPV was recorded for the PVES system, as it generated surplus energy for nighttime use, reflecting a more favorable payback period compared to other models that rely solely on CE.
The economic viability of red tilapia production using photovoltaic energy systems can be significantly influenced by market variables such as feed prices, labor costs, and selling expenses. A sensitivity analysis was conducted to evaluate the effects of a 10 percent reduction in these costs on the total operating cost (TOC) and profitability metrics. Feed, which constitutes the largest proportion of production costs (up to 41 percent in this study), was analyzed under a reduced-price scenario. A 10 percent reduction in feed costs would lower the TOC by approximately 4 percent, improving the gross profit margins, particularly in energy-intensive systems like CE and CPVE. This is particularly relevant given the dependency on high-protein diets in biofloc systems.
Labor costs, representing around 20 percent of production costs across systems, were similarly analyzed for a 10 percent reduction. Such a decrease would reduce TOC by 2 percent, offering greater financial flexibility for small-scale producers. Strategies to achieve this could include the adoption of labor-efficient practices or scaling up production to maximize the use of existing personnel without compromising operational efficiency.
Selling costs, which are influenced by intermediary pricing and logistical expenses, also play a crucial role in determining profitability. A 10 percent reduction in selling costs, achieved through direct-to-consumer marketing strategies or improved supply chain efficiencies, could further reduce TOC by approximately 1–2 percent, amplifying net revenue. These reductions collectively highlight the importance of optimizing production inputs and sales strategies to buffer against market uncertainties and enhance the economic feasibility of aquaculture systems.
By integrating these adjustments, the financial performance of PVES systems in particular becomes increasingly attractive, with improved payback periods and higher net present value (NPV). This analysis underscores the potential for targeted interventions in cost reduction to improve the sustainability and profitability of aquaculture operations, particularly for small-scale producers who are more vulnerable to market fluctuations.
Perspectives
The study’s economic analysis suggests that the PVES strategy shows promising results. With a lower initial investment compared to the PVE system, the PVES strategy eliminates the need for batteries by selling surplus energy during the day to offset nighttime consumption. This reduces dependency on costly energy storage systems while maintaining efficient production. Consequently, the PVES treatment lowers total operating costs and increases gross profit margins, making it an economically attractive option for sustainable aquaculture in sun-rich regions.
Further studies should be conducted to evaluate the value chain of red tilapia, thus improving economic results. Research should be conducted on energy sources for the biofloc system and tools should be sought that allow more efficient use of specialized labor, e.g., increase the productive units and calculate the number of workers needed for the units, without negatively affecting the production costs. Overall, the reduction in energy costs discussed highlights the potential for solar energy systems to enhance the economic viability of aquaculture production, making these systems a favorable and sustainable option.
Now that you've reached the end of the article ...
… please consider supporting GSA’s mission to advance responsible seafood practices through education, advocacy and third-party assurances. The Advocate aims to document the evolution of responsible seafood practices and share the expansive knowledge of our vast network of contributors.
By becoming a Global Seafood Alliance member, you’re ensuring that all of the pre-competitive work we do through member benefits, resources and events can continue. Individual membership costs just $50 a year.
Not a GSA member? Join us.
Author
-
Daniel Leonardo Cala-Delgado, MVZ
Corresponding author
Grupo de Investigación en Ciencias Animales, Facultad de Medicina Veterinaria y Zootecnia, Universidad Cooperativa de Colombia, Bucaramanga 680001, Colombia; and Centro de Aquicultura da Unesp, Universidade Estadual Paulista (Unesp), s/n, Jaboticabal CEP 14884-900, SP, Brazil[111,99,46,117,100,101,46,99,99,117,115,117,112,109,97,99,64,97,108,97,99,46,108,101,105,110,97,100]
Tagged With
Related Posts
Responsibility
Assessing the carbon footprint of aquaculture
A carbon footprint is an estimate of the total carbon emissions resulting from the production, use and disposal of a product or service. Carbon footprints for aquaculture products result mainly from the use of manufactured feed and mechanical aeration.
Responsibility
A comparison of resource use in shrimp farming, part 3: Energy
In part three of this series, the authors say lower energy use in shrimp farming requires producers to focus on water exchange and aeration.
Intelligence
Solar Oysters and Blue Oyster Environmental launch solar-powered oyster production system
A prototype of Solar Oysters' solar-powered oyster production system will operate on Hoopers Island Oyster Company’s lease in 2024.
Innovation & Investment
‘Possible, but still far away’: Offshore wind farms and aquaculture may one day go hand-in-hand
Initiatives to unite aquaculture and offshore wind farms are popping up globally but they face technical, cost and environmental challenges.


![Ad for [membership]](https://www.globalseafood.org/wp-content/uploads/2025/07/membership_web2025_1050x125.gif)
