Understanding gene functions to improve production efficiency
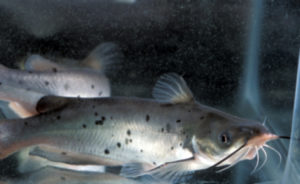
Recent high feed costs have caused some channel catfish farmers to reduce feeding frequency or use less-expensive protein sources in feed. Although they save money, these changes can result in slower growth using standard practices.
Another method to help farmers reduce their feed costs is the use of catfish that are more efficient converters of feed to muscle. Fish with superior feed conversion must be identified and lines developed from these superior individuals.
The traditional method of selecting broodstock that are efficient consumers of feed involves lengthy, expensive and labor-intensive studies involving several lines of catfish families over several generations. However, identifying feed-efficient individuals through DNA analysis could be cheaper and require fewer lines of fish.
The first step in the analysis is to understand what gene products are involved in the regulation of feed intake and how these gene products function. For example, what genes are involved in signaling hunger, and what genes are involved in telling the fish to stop eating?
Feed intake regulation
Feed consumption in both mammals and fish is regulated by many hormones and chemicals called neurotransmitters, which are produced by nerve cells within the brain. One group of nerve cells produces neurotransmitters that increase feed intake, whereas another group of nerve cells produces neurotransmitters that inhibit feed intake.
One neurotransmitter that inhibits feed intake is cocaine-and amphetamine-regulated transcript (CART). Food deprivation reduces CART production in both fish and mice. Injection of CART into the brain decreases feed intake by inhibiting the action of neuropeptide Y (NPY), which stimulates feed intake. Both CART and NPY are neurotransmitter proteins that are encoded by their respective genes.
Previous research
The authors’ studies at the Thad Cochran Warmwater Aquaculture Center in Stoneville, Mississippi, USA, have showed that lines of channel catfish selected for increased growth generally consumed more feed than catfish with slower growth.
The authors examined differences in NPY production between faster- and slower-growing catfish because NPY is known to be involved in feed intake, but there was no difference in NPY gene activity between faster-growing and slower-growing catfish. Based on these results, they speculated that differences in feed intake were caused by differences in the amount of neurotransmitters that decreased, rather than increased, feed intake.
If so, differences in the levels of a feeding inhibitor could lead to differences in growth between genetic lines of fish. More recent research has therefore focused on CART, the inhibitory neurotransmitter.
Current research
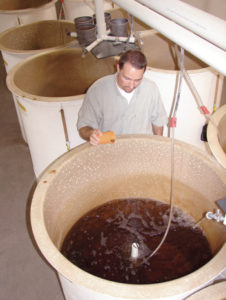
The authors first used molecular biotechnology to identify the catfish CART gene sequence, which allowed them to deduce the amino acid sequence of the CART protein. The CART sequence was very similar to that of mammals and other fish species. The authors then developed a molecular tool to measure changes in the levels of CART gene activity in the catfish brain after prolonged food deprivation.
A group of juvenile channel catfish was fasted for 30 days, while another group received feed daily during the same period. After the fasting period, brain tissue was collected from five fish in each group. The remaining fish in each group were fed for 15 additional days before their tissue was collected.
CART gene activity was compared among the four groups of fish. The study showed that 30 days of fasting reduced CART gene activity, and 15 days of refeeding restored CART gene activity to a level observed in the fish fed daily.
CART expression
Another study tested the hypothesis that differences in feed intake between lines of catfish with different growth rates were caused by differences in the amount of CART in their brains. The authors measured the feed intake and deficiency, weight gain and CART expression in the brains of fast- and slow-growing channel catfish.
Fish with faster growth consumed, on average, 97.1 grams more feed and weighed 80.7 grams more at the end of a seven-week period than fish with slower growth, while feed-conversion efficiency was similar for the two fish groups. The faster-growing fish also showed less CART gene activity in their brains than the slower-growing fish.
(Editor’s Note: This article was originally published in the July/August 2008 print edition of the Global Aquaculture Advocate.)
Now that you've reached the end of the article ...
… please consider supporting GSA’s mission to advance responsible seafood practices through education, advocacy and third-party assurances. The Advocate aims to document the evolution of responsible seafood practices and share the expansive knowledge of our vast network of contributors.
By becoming a Global Seafood Alliance member, you’re ensuring that all of the pre-competitive work we do through member benefits, resources and events can continue. Individual membership costs just $50 a year.
Not a GSA member? Join us.
Authors
-
Yasuhiro Kobayashi, Ph.D.
Division of Biological and Physical Sciences
Delta State University
Cleveland, Mississippi 38733 USA -
Brian C. Peterson, Ph.D.
Thad Cochran National Warmwater Aquaculture Center
USDA -ARS
Stoneville, Mississippi, USA -
Geoffrey C. Waldbieser, Ph.D.
Thad Cochran National Warmwater Aquaculture Center
USDA -ARS
Stoneville, Mississippi, USA
Related Posts
Innovation & Investment
Assessing coloration in channel catfish fillets
Because consumers look at color to gauge quality of catfish fillets, the authors developed a digital photography measurement method to assess yellowness.

Health & Welfare
Biofloc technology reduces common off-flavors in channel catfish
In studies that used biofloc systems to culture channel catfish, culture tanks were susceptible to episodes of geosmin and 2-methylisoborneol and subsequent bioaccumulation of off-flavors in catfish flesh.
Health & Welfare
A study of Zoea-2 Syndrome in hatcheries in India, part 2
Indian shrimp hatcheries have experienced larval mortality in the zoea-2 stage, with molt deterioration and resulting in heavy mortality. Authors considered biotic and abiotic factors. Part 2 describes results of their study.
Health & Welfare
A study of Zoea-2 Syndrome in hatcheries in India, part 3
In this third and final part, authors present recommendations to help reduce the incidence of Zoea-2 Syndrome, which is not caused by any known infectious agents in P. vannamei hatcheries in India.


