Can automatic measuring replace humans when evaluating a shrimp fishery?
Despite some deviations between manual and automatic measurements for individual shrimp, the automatic method proved sufficiently accurate for stock, gear selectivity and compliance assessment
Accurate estimates of fish population abundance and size distribution are vital for effective fisheries management. Specifically, size measurements of fish and crustacean species play a critical role in fishery stock assessments, fishing gear size selectivity studies and monitoring compliance with fisheries management regulations. In particular, the dynamics of species length distribution is essential for analyzing marine population dynamics and making informed management decisions about exploited stocks.
The data on composition of catches are crucial for stock assessments and management strategies, and the data on the sizes of released and retained species is critical for evaluating size selectivity, helping optimize gear designs for species-specific size discrimination. And regulations may then limit the proportion of undersized individuals in catches, with non-compliance potentially leading to the closure of fishing areas. In such cases the check for compliance is dependent on the size measuring of individuals in the catch.
However, in almost all fisheries, the length estimation of fish and crustacean species is still done manually. Automation, on the other hand, has the potential to enhance the accuracy, efficiency and consistency of species measurement, thereby improving the reliability of stock assessment data. Specifically, the developments in artificial intelligence (AI) methods, often combined with computer vision, have significant potential to enhance data collection and processing in marine applications. This potential is highlighted by the formation of the Working Group on Machine Learning Applications in Marine Science (WGMLEARN) by the International Council for the Exploration of the Sea (ICES) in 2019.
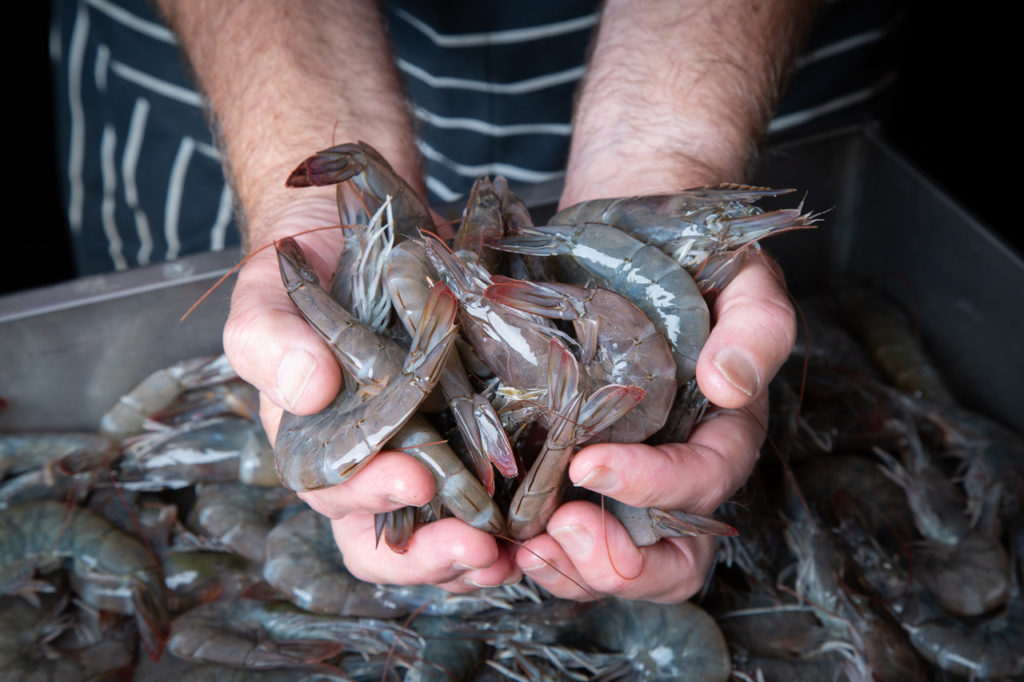
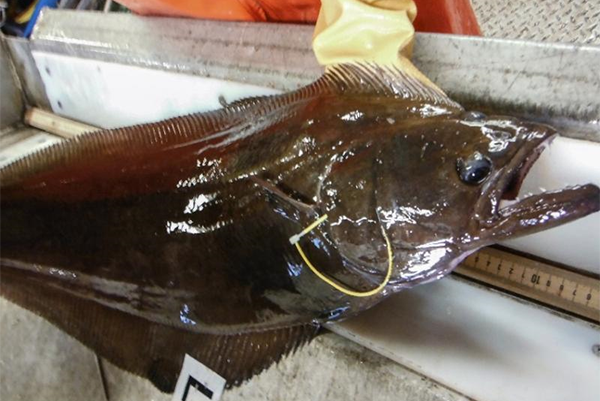
Deep learning can automate the labor-intensive task of accurately locating the heads and tails of fish, replacing manual methods with computer vision-based algorithms. For crustacean species, such as shrimp, automated size measurement using computer vision and AI is increasingly applied, particularly in aquaculture. The carapace length, often measured with a caliper (Fig. 1), is a standard size metric for shrimp. This manual measurement process can be exhausting and time-consuming, especially when hundreds of individuals across multiple samples need to be recorded.

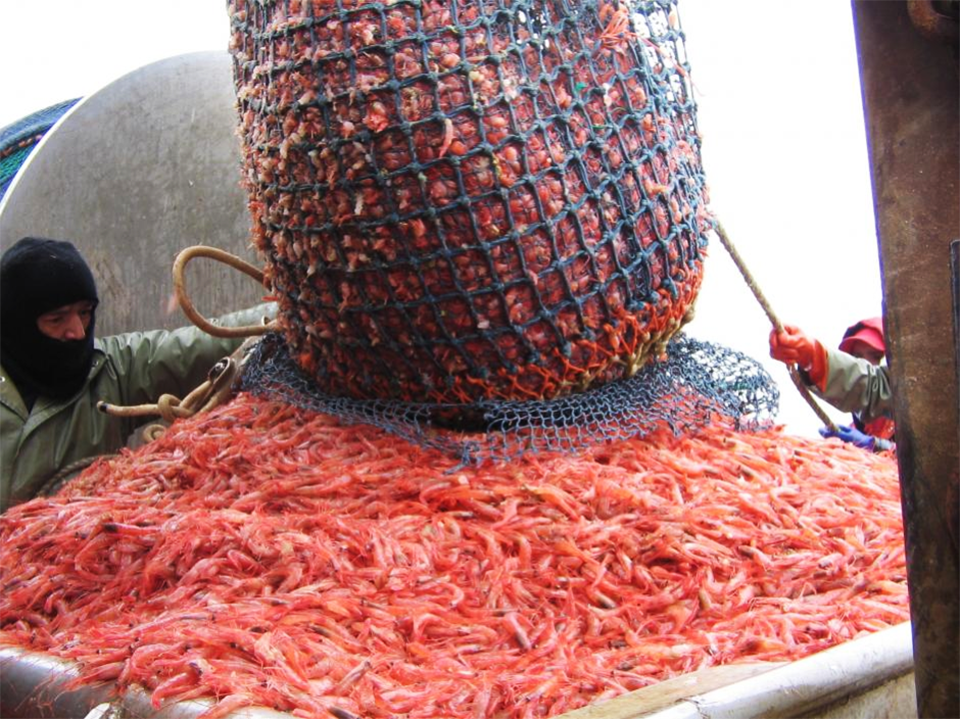
This article – summarized from the original publication – reports on a study that examined whether the manual measurement of northern shrimp (Pandalus borealis) – a deep-water, commercially important species that is harvested using demersal trawls along the Norwegian coast since the early 20th century – size, for purposes such as stock assessment, gear size selectivity, and compliance monitoring, can be replaced by an automated measurement system. This system utilizes off-the-shelf camera technology integrated with a general-purpose artificial intelligence algorithm.
Study setup
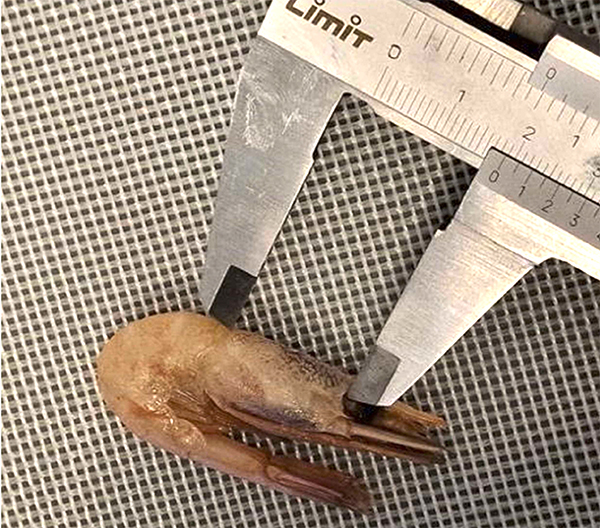
Field data sampling was conducted during several hauls on a research cruise with the trawler “Helmer Hanssen” in the Barents Sea in February 2023. Samples of shrimp were collected from the cod end, and for each of the sampled shrimp i, the carapace length was measured with a caliper, as shown in Fig. 1, to obtain a clmi value (manually measured carapace length by a human).
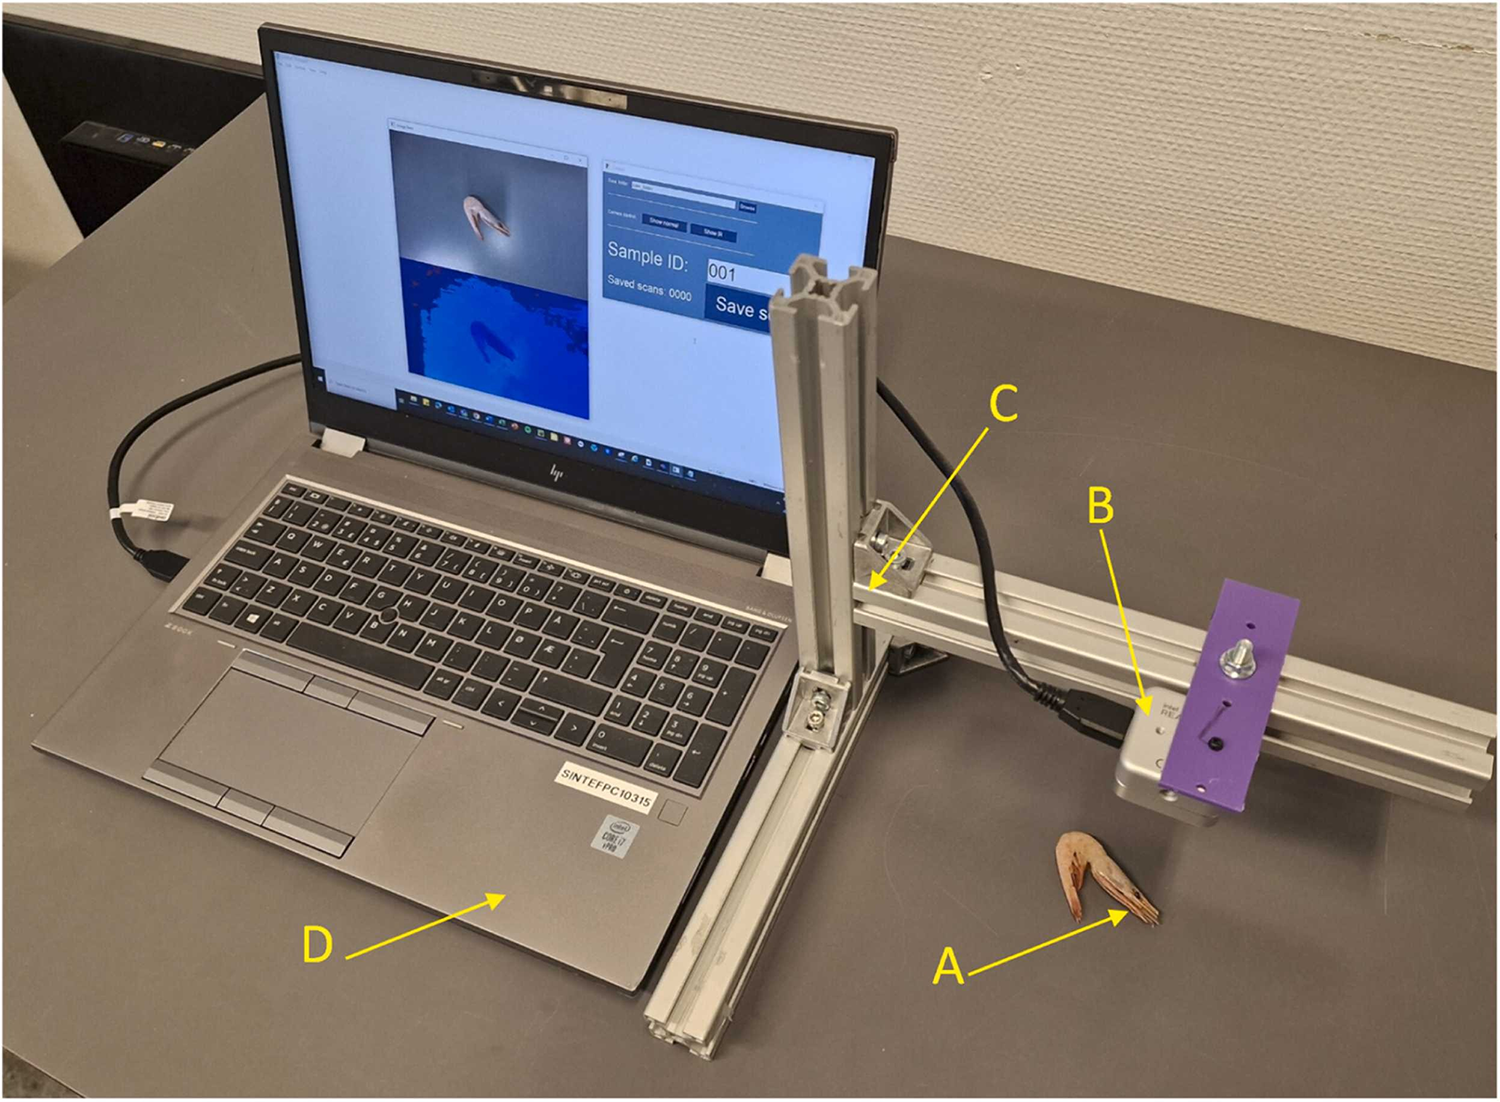
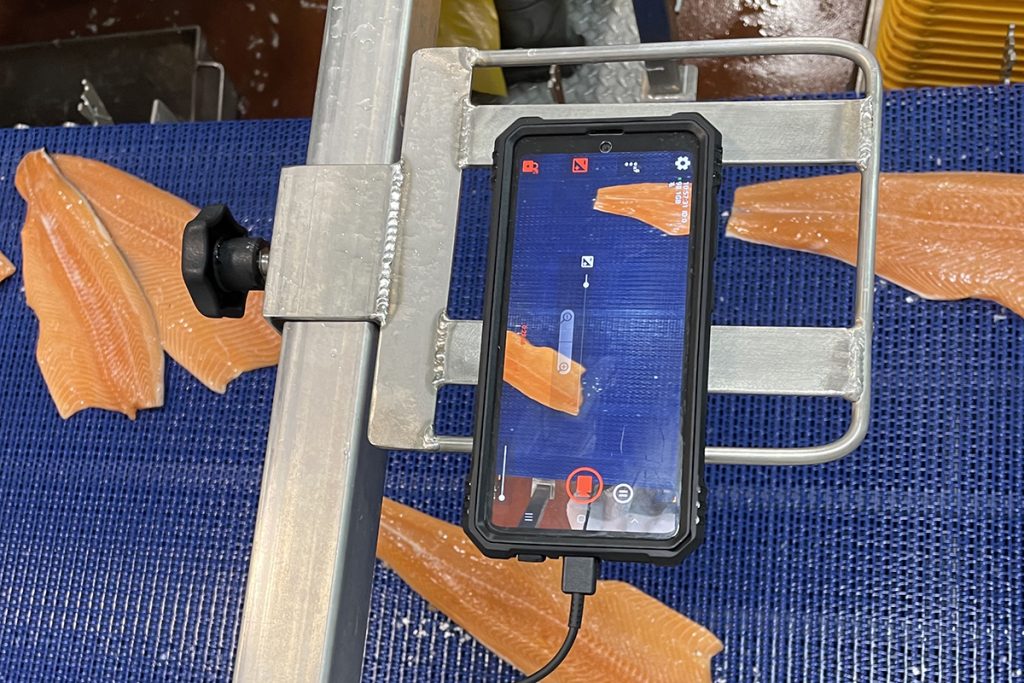
The same shrimp was then placed in the image acquisition scene (Fig. 2) to obtain corresponding image data, which ultimately led to a clai value for the automatic measurement of the carapace length of the shrimp by using image analysis.
For detailed information on the experimental design, data acquisition and equipment used, and data analyses, refer to the original publication.
Results and discussion
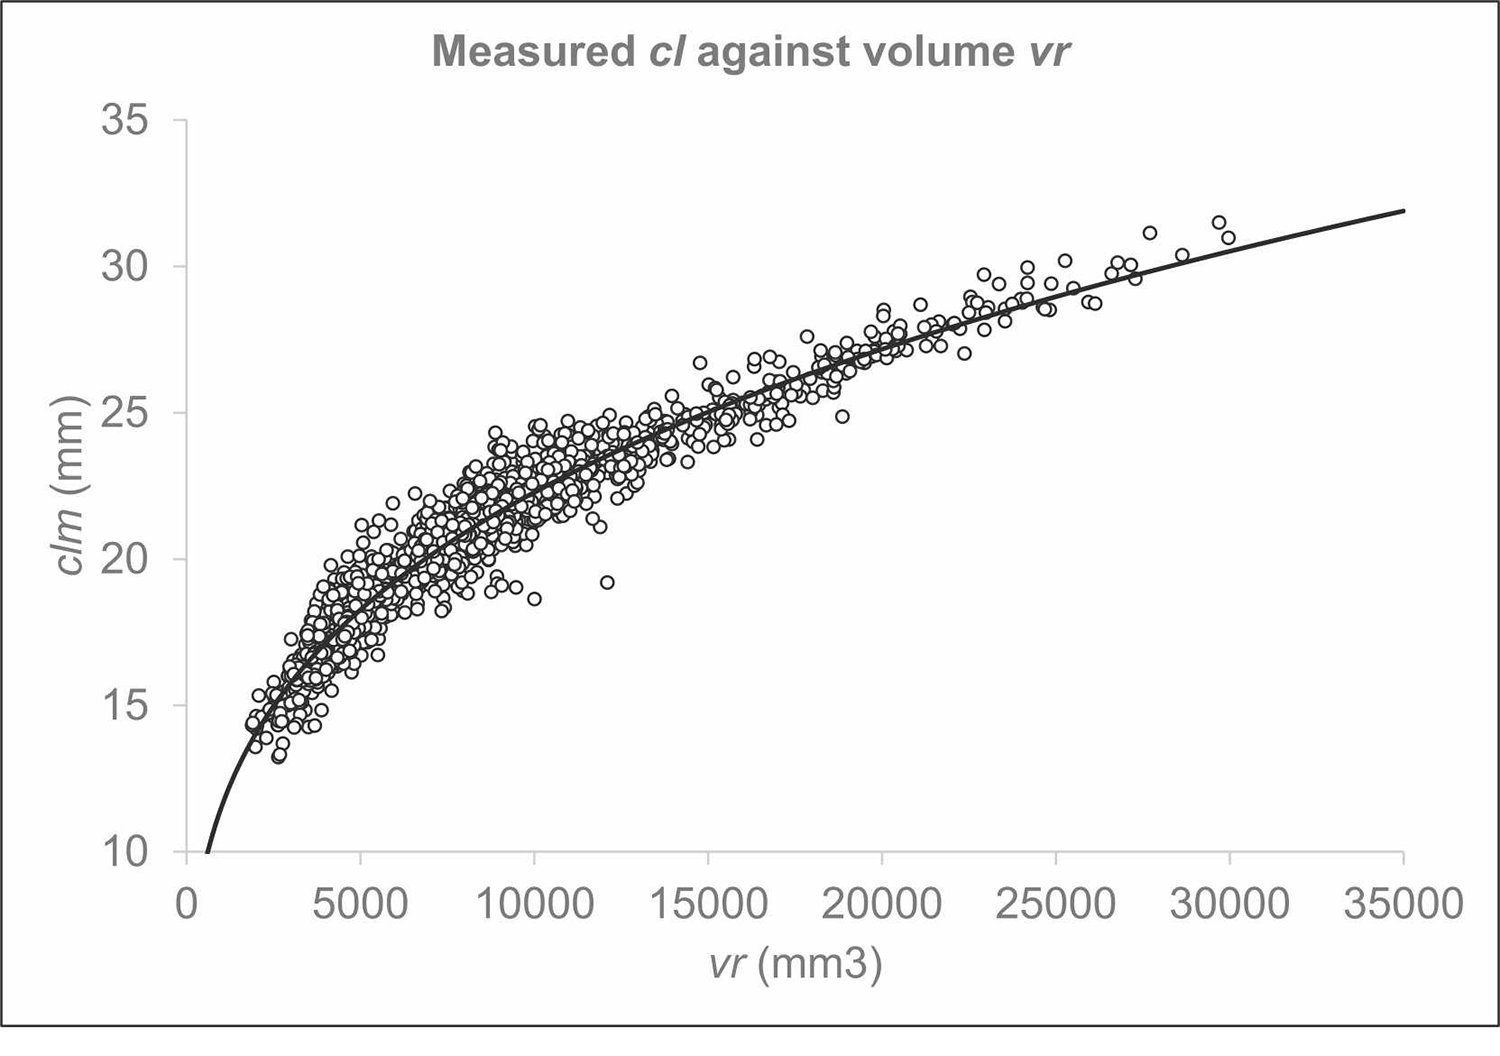
A total of 2,167 shrimp were sampled on the research vessel Helmer Hanssen. Deep-water shrimp were measured one by one, first manually and then automatically immediately afterwards. The measured size range for carapace length was 13.23 mm to 31.50 mm. Using the acquisition and image analysis (refer to original publication for details), 2,167 corresponding values for carapace length for individual shrimp, clmi, and individual shrimp volume, vri, were obtained and used to establish the values for the equations developed. The correlation between vs and clm was strong (Fig. 4).
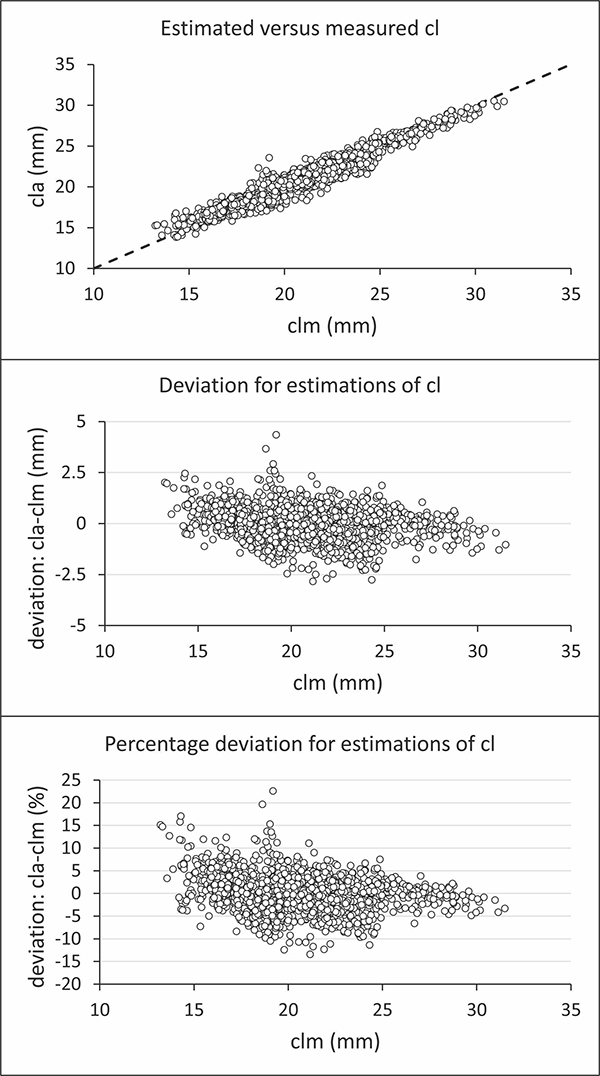
Regarding the performance of automatic assessment on an individual basis, plotting automated carapace length, cla, against manual carapace length, clm, for the sampled shrimp showed the data centered around the baseline for zero deviation (Fig. 5, top panel). However, this plot also demonstrated some deviations, quantified by a mean absolute deviation at 0.55 mm, corresponding to a percentage deviation of 2.73 percent. The mean deviation is much smaller, with a value at 0.00023 mm, demonstrating that on a population basis, the automatic method provides a nearly unbiased value. However, the standard deviation is 0.72 mm, showing that predictions on a single shrimp basis are not perfect. Nonetheless, the distribution of individual estimation deviations demonstrates that most are within ±2.5 mm (Fig. 6, center panel) and within ±10 percent (Fig. 5, lower panel).
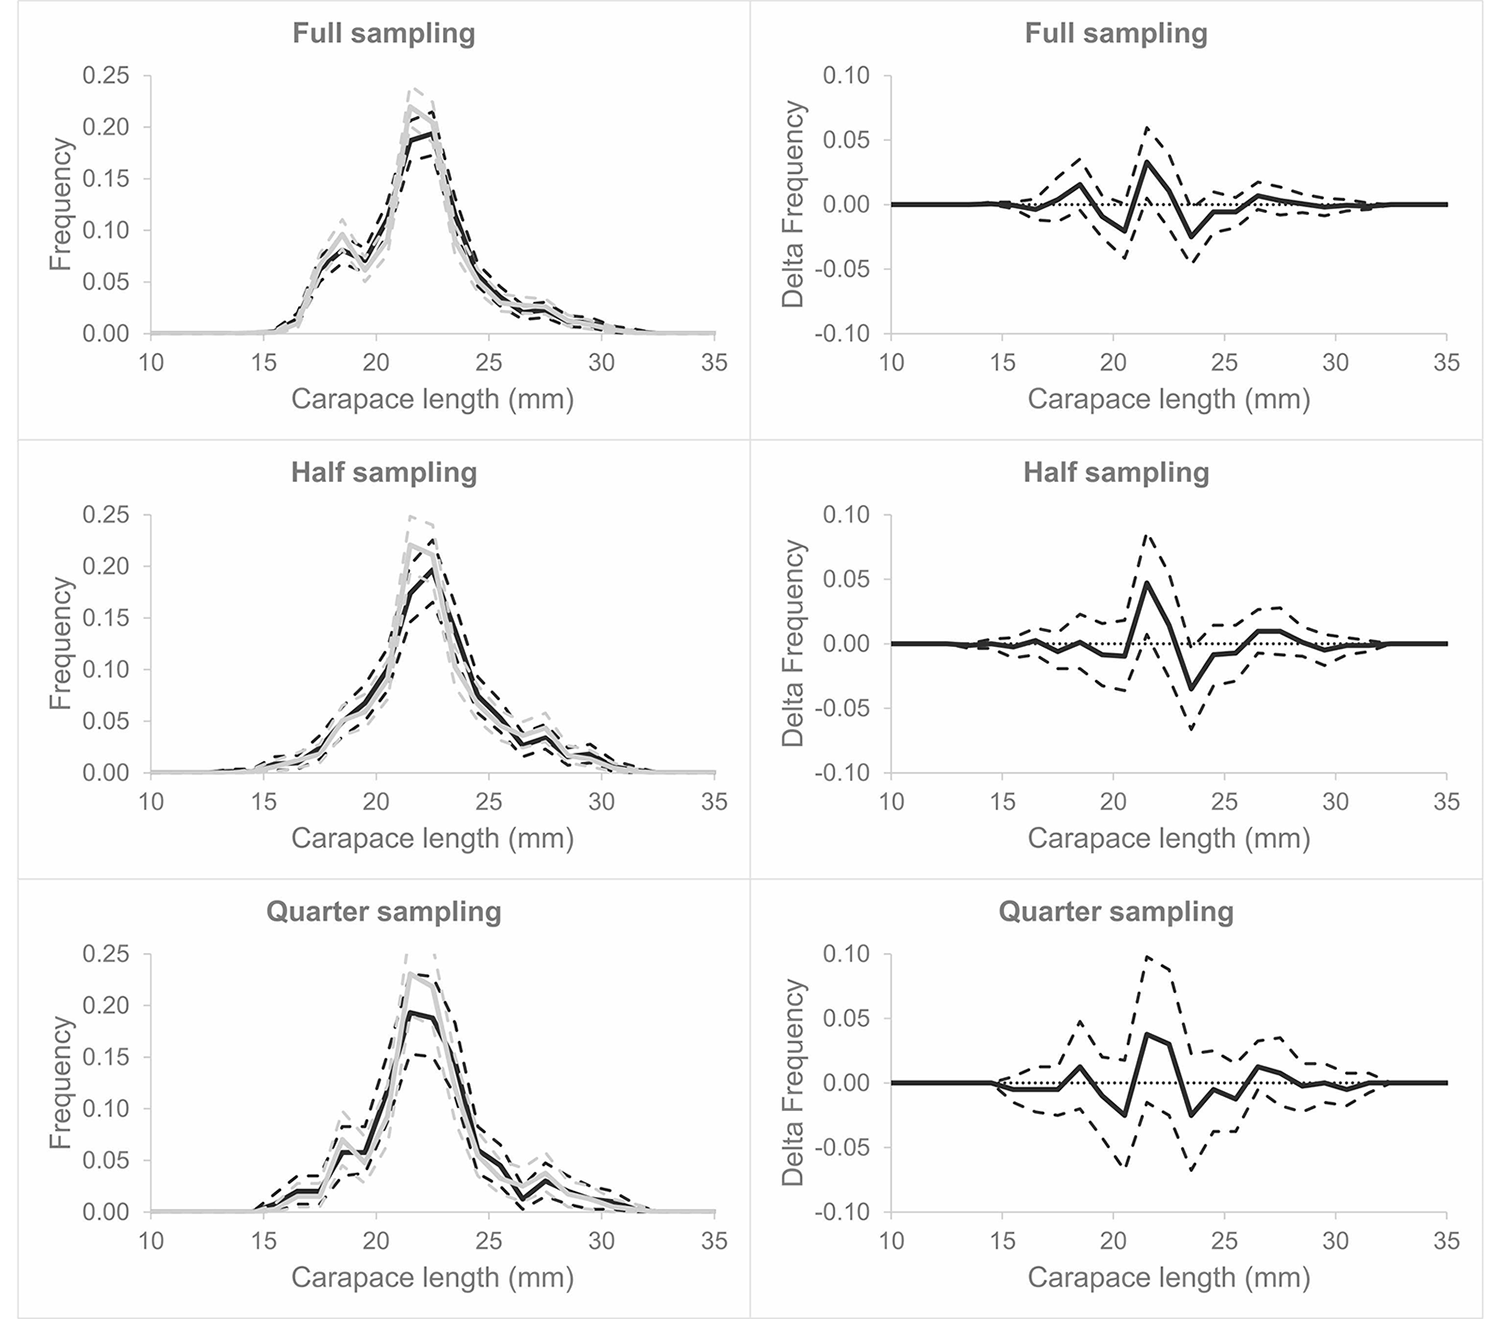
The evaluation of the performance of the automatic measuring method for stock assessment purposes was based on comparing the population distributions of shrimp cl obtained from the Mdata (manually measured) and Adata (automatically measured). The frequency plots showed very similar distributions for the two methods for full, half, and quarter samplings, with overlapping carapace lengths, CIs (Fig. 6, left column). This is further supported by the other (delta) plots, which identified only one length class (cl = 21.5) where the CIs did not contain the baseline value of 0.0 for no difference in both full and half sampling, while no significant difference was observed for quarter sampling (Fig. 6, right column).
We investigated whether an automatic method using computer vision and artificial intelligence for measuring the carapace length of deep-water shrimp can replace the current manual method using a caliper when data is used for stock assessment, fishing gear size selectivity estimation, or fisheries management purposes. Judging whether the automatic method provides sufficient accuracy to replace the current method for a specific purpose is challenging when based solely on comparing individual values for carapace length obtained with the two methods (Fig. 5).
Specifically, we investigated the consequences on the results in stock assessment, fishing gear size selectivity estimation, and fisheries compliance control if one or the other measuring method was used to obtain the dataset for the assessment. We compared results, including considering uncertainty in the results due to sample sizes, to evaluate whether applying one or the other measuring method led to significant differences in outcomes. For uncertainty estimation, we adopted the same methods commonly applied within the specific domain to make our assessment as realistic as possible. We believe that the outlined and applied use case-driven approach for evaluating whether a new measuring method can replace an existing one has advantages compared to judging based on single sample measures.
Based on our use case-driven approach, we found that an automatic measuring procedure based on “off-the-shelf” camera technology combined with a general-purpose artificial intelligence algorithm can provide sufficient accuracy to replace manual measurement of deep-water shrimp for data use in stock assessment, gear size selectivity and compliance control assessment purposes, despite some deviations in individual shrimp size measurements between the manual and automatic methods.
If we had based the evaluation solely on a non-use case-driven approach, we would not have been able to determine whether the automatic method provided sufficient accuracy to replace the manual method. This demonstrates the usefulness of adopting a use case-driven approach for the performance evaluation of a new measuring technique, as done in this study.
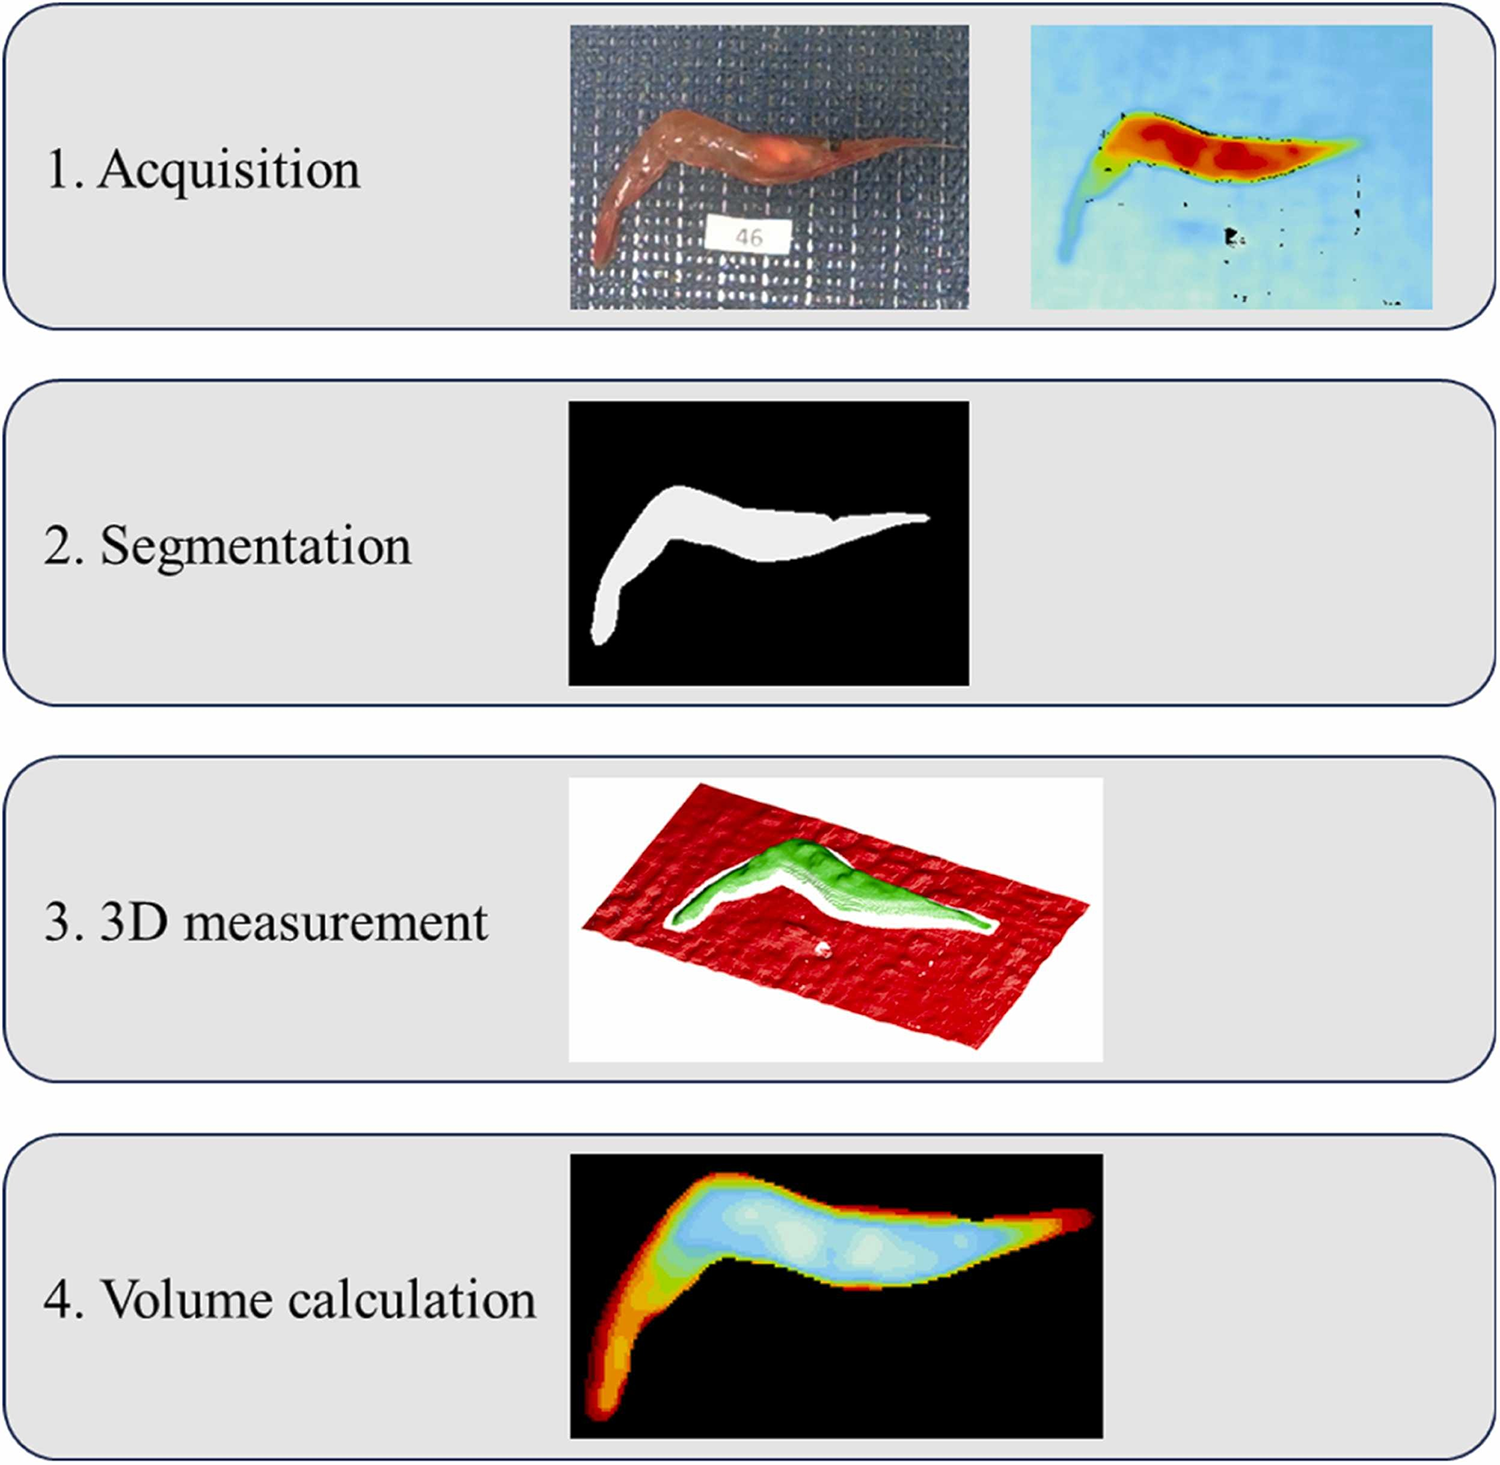
The manual measurement of the size of deep-water shrimp with a caliper is a direct measuring procedure of the attribute of interest (here, the carapace length). However, automatically identifying and locating the two endpoints defining the carapace length on every image can be challenging. Therefore, for our computer vision-based method, we used an indirect approach by utilizing a strong correlation between the shrimp volume vr and the carapace length. In this respect, our measurement approach has some similarities with the method investigated by Harbitz, who based the estimation on a correlation between shrimp area and carapace length.
Despite the issue with the side of the shrimp facing away from the camera that is obscured in our acquisition method, we believe that using volume vr instead of, for example, area provides a more robust measurement regarding segmentation errors (separating the shrimp from the background). Compared to area measurement, where each segmented pixel contributes equally to the area sum, a pixel in the center of the shrimp contributes more to the total volume due to its height measurement, than an erroneously segmented pixel at the border of the shrimp, e.g., segmentation of its whiskers. However, future work could compare these two methods in detail. Other examples of using artificial intelligence in combination with computer vision to assess shrimp size by means of other estimation procedures include Lin et al., and Setiawan et al.
Perspectives
Our study is another example of how modern technology, in this case based on computer vision and artificial intelligence, provides new possibilities for data sampling and processing in marine science applications, aligning with the objectives of the Working Group on Machine Learning in Marine Science (WGLEARN). A comprehensive reference list of works and methods for marine applications of artificial intelligence can be found in Rubbens et al.
Now that you've reached the end of the article ...
… please consider supporting GSA’s mission to advance responsible seafood practices through education, advocacy and third-party assurances. The Advocate aims to document the evolution of responsible seafood practices and share the expansive knowledge of our vast network of contributors.
By becoming a Global Seafood Alliance member, you’re ensuring that all of the pre-competitive work we do through member benefits, resources and events can continue. Individual membership costs just $50 a year.
Not a GSA member? Join us.
Author
-

Corresponding author
SINTEF Ocean, Brattørkaia 17C, Trondheim N-7010, Norway
Related Posts
Innovation & Investment
Ascending U.K. prawn farms now riding out the coronavirus storm
U.K. prawn farms FloGro Fresh and Great British Prawns believe demand for trusthworthy, local food will carry them past the COVID-19 market disruption.
Fisheries
Artificial neural networks can predict age in Greenland halibut using otolith images
Deep learning technology can estimate individual ages and age distribution of Greenland halibut with more consistency than human estimations.

Intelligence
First Nations-led artificial intelligence technology holds promise for salmon recovery
New artificial intelligence monitoring tool is "remarkably adept" at identifying and counting fish species.
Fisheries
Make seafood production and processing more responsive and responsible? Sounds like a job for AI
Environmental reporting and quality control are two additional areas in which artificial intelligence can boost seafood producers' performance.